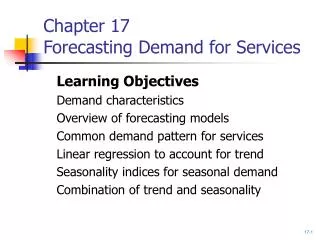
Forecasting Demand for Services
Forecasting Demand for Services. Learning Objectives. Recommend the appropriate forecasting model for a given situation. Conduct a Delphi forecasting exercise. Describe the features of exponential smoothing.


Forecasting Demand for Services
E N D
Presentation Transcript
Learning Objectives • Recommend the appropriate forecasting model for a given situation. • Conduct a Delphi forecasting exercise. • Describe the features of exponential smoothing. • Conduct time series forecasting using exponential smoothing with trend and seasonal adjustments.
Forecasting Models • Subjective Models Delphi Methods • Causal Models Regression Models • Time Series Models Moving Averages Exponential Smoothing
N Period Moving Average Let : MAT = The N period moving average at the end of period T AT = Actual observation for period T Then: MAT = (AT + AT-1 + AT-2 + …..+ AT-N+1)/N Characteristics: Need N observations to make a forecast Very inexpensive and easy to understand Gives equal weight to all observations Does not consider observations older than N periods
Moving Average Example Saturday Occupancy at a 100-room Hotel Three-period Saturday Period Occupancy Moving Average Forecast Aug. 1 1 79 8 2 84 15 3 83 82 22 4 81 83 82 29 5 98 87 83 Sept. 5 6 100 93 87 12 7 93
Exponential Smoothing Let : ST = Smoothed value at end of period T AT = Actual observation for period T FT+1 = Forecast for period T+1 Feedback control nature of exponential smoothing New value (ST ) = Old value (ST-1 ) + [ observed error ] or :
Exponential SmoothingHotel Example Saturday Hotel Occupancy ( =0.5) Actual Smoothed Forecast Period Occupancy Value Forecast Error Saturday t At St Ft |At - Ft| Aug. 1 1 79 79.00 8 2 84 81.50 79 5 15 3 83 82.25 82 1 22 4 81 81.63 82 1 29 5 98 89.81 82 16 Sept. 5 6 100 94.91 90 10 MAD = 6.6 Forecast Error (Mean Absolute Deviation) = ΣlAt – Ftl/n
Exponential SmoothingImplied Weights Given Past Demand Substitute for If continued:
Exponential Smoothing Weight Distribution Relationship Between and N (exponential smoothing constant) : 0.05 0.1 0.2 0.3 0.4 0.5 0.67 N (periods in moving average) : 39 19 9 5.7 4 3 2
Saturday Hotel Occupancy Effect of Alpha ( =0.1 vs. =0.5) Actual Forecast Forecast
Exponential Smoothing With Trend Adjustment Commuter Airline Load Factor Week Actual load factor Smoothed value Smoothed trend Forecast Forecast error t At St Tt Ft | At - Ft| 1 31 31.00 0.00 2 40 35.50 1.35 31 9 3 43 39.93 2.27 37 6 4 52 47.10 3.74 42 10 5 49 49.92 3.47 51 2 6 64 58.69 5.06 53 11 7 58 60.88 4.20 64 6 8 68 66.54 4.63 65 3 MAD = 6.7
Exponential Smoothing with Seasonal Adjustment Ferry Passengers taken to a Resort Island Actual Smoothed Index Forecast Error Period t At value St It Ft | At - Ft| 2003 January 1 1651 ….. 0.837 ….. February 2 1305 ….. 0.662 ….. March 3 1617 ….. 0.820 ….. April 4 1721 ….. 0.873 ….. May 5 2015 ….. 1.022 ….. June 6 2297 ….. 1.165 ….. July 7 2606 ….. 1.322 ….. August 8 2687 ….. 1.363 ….. September 9 2292 ….. 1.162 ….. October 10 1981 ….. 1.005 ….. November 11 1696 ….. 0.860 ….. December 12 1794 1794.00 0.910 ….. 2004 January 13 1806 1866.74 0.876 - - February 14 1731 2016.35 0.721 1236 495 March 15 1733 2035.76 0.829 1653 80
Topics for Discussion • What characteristics of service organizations make forecast accuracy important? • For each of the three forecasting methods, what are the developmental costs and associated cost of forecast error? • Suggest independent variables for a regression model to predict the sales volume for a proposed video rental store location. • Why is the N-period moving-average still in common use if the simple exponential smoothing model is superior? • What changes in α, β, γ would you recommend to improve the performance of the trendline seasonal adjustment forecast shown in Figure 11.4?
Interactive Exercise: Delphi ForecastingQuestion: In what future election will a woman become president of the united states?