Download
1 / 45
470 likes | 643 Views
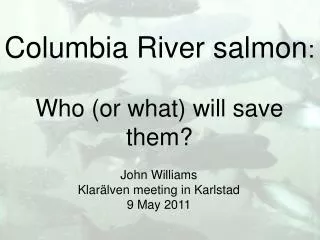
Columbia River salmon : Who (or what) will save them?. John Williams Klar ä lven meeting in Karlstad 9 May 2011. Road Map Columbia River history decline of salmon stocks Endangered Species Act detour - survival studies recent trends. present controversies. The Players:

E N D
Columbia River salmon: Who (or what) will save them? John Williams Klarälven meeting in Karlstad 9 May 2011
Road Map • Columbia River history • decline of salmon stocks • Endangered Species Act • detour - survival studies • recent trends • present controversies
The Players: • Dam operators (COE) • Power marketers (BPA and PUDs) • Water users (BuRec/irrigators/tow boats) • Environmental advocates • Native tribes • Fishers • States • Federal Government (regulators) • Federal Court system • Scientists • Mother nature
Conclusion • Science--range of results for different options • Science--will not resolve policy issues: • recovery objective • acceptable risk for failure to achieve objective • burden of proof--on fish or status quo • allocation of impacts among constituencies: who pays
Causes of decline • (anthropogenic) • harvest • habitat • hydropower • (but need to consider all dams) • hatcheries
Columbia River salmon - peak runs 1,000s of fish (After Chapman TAFS – 1986) Chinook - Spring 400 - 500 Summer 1,700 - 2,000 Fall 1,100 - 1,250 3,200 – 3,750 Steelhead 382 - 449 Sockeye 1,915 - 2,253
Mitchell Act - 1938 • Historic location • Present location
Historic Present
Bonneville McNary Lower Granite
Hydropower dam completion Stocks listed
‘Gas bubble disease’ Changed flow Cumulative turbine mortality
Solutions to address • problems • Spill – fix conditions, • more of it, surface routes • 2. Install bypass systems • 3. Transportation • 4. Hatcheries (?) • 5. Restore flow • 6. Decrease harvest * Wild Hatchery
Hatcheries • Juvenile releases • Effects on wild spawners
Smolt survival estimation Historically - freeze-branded fish, batch marked estimated collection efficiency expanded count to obtain population compared populations at dams
Smolt survival estimation At present - PIT-tags (radio or acoustic tags) identify individual fish maximum likelihood estimation based on Cormack, Jolly, Seber procedures
Single-Release of Tagged Individuals Two “recapture” occasions R P1 P2 (l=S2p2) S1 S2 Mark-Recapture Data = Possible PIT-Tag Detection Histories Detection histories record outcome of series of conditionally independent events. Histories constitute multinomial sample. Probability of each history depends on conditional survival and detection probabilities. 111 : S1P1l 110 : S1P1 (1-l) 101 : S1(1-P1 ) l 100 : (1-S1 )+S1(1-P1) (1-l)
Many assumptions • Some not met exactly • Bias in survival estimates
Status of stocks at present (empirical data)
(after Scheuerell and Williams. 2005. Fish & Ocean) R2 = 0.71
But, absolute numbers of wild fish returns less
What will happen in the future?
Karluk Lake δ15N From Finney et al. (2002). Nature It is difficult to know where to go, when we don’t know where we are. Anchovy scales Sardine scales Saanich fish remains 0 400 800 1200 1600 AD2000 Calendar age
Actions planned • continue harvest limitations • consider decreasing hatchery • production • improve spawning, rearing, • and migration habitat • ‘tweak’ hydropower system
Summary • stocks declined concurrent with hydropower construction • direct juvenile survival now high • run timing of smolts critical • ocean influences return rates • hydropower now ‘takes’ some juveniles that historically would have become adult harvest • unclear how much improvement in habitat possible • unclear effect of hatcheries
controversial • -- environmental activists want dams removed • -- federal judge tends to side with environmental activists – dams limit recovery • -- effect of habitat and hatcheries ?? • -- do not have means to predict future • -- concerns about how climate will affect stocks • -- effect of anthropogenic changes on productivity and abundance ??
Thanks for your attention Comments? Questions?