Download
1 / 43
430 likes | 462 Views
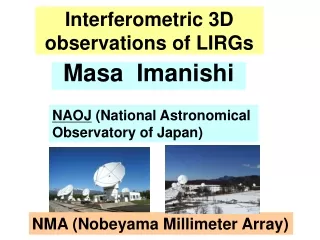
Interferometric 3D observations of LIRGs. NAOJ (National Astronomical Observatory of Japan). Masa Imanishi. NMA (Nobeyama Millimeter Array). optical. LIRGs. IR. IR. optical. M100 ( Sbc ). Luminous energy source is hidden behind dust. Luminous infrared galaxies ( LIRGs ).

E N D
Interferometric 3D observations of LIRGs NAOJ (National Astronomical Observatory of Japan) Masa Imanishi NMA (Nobeyama Millimeter Array)
optical LIRGs IR IR optical M100(Sbc) Luminous energy source is hidden behind dust Luminous infrared galaxies(LIRGs) L(IR) > 10^11 Lsun (Normal spiral ~ 10^10 Lsun)
NLR LIRGs have a large amount of nuclear gas and dust Buried AGNs are elusive >80% LIRGs = non-Sy AGNs in LIRGs are buried AGNs obscured by torus-shaped dust Sy2 Detectable via optical spectroscopy
Compton thick (NH>10^24 cm-^2) buried AGN in LIRGs Future X-ray satellite sensitive at E > 10keV buried AGN or compact SB ? X-ray : AGN >> SB
Maloney et al.1996 Effects to the surrounding ISM XDR around an X-ray emitting buried AGN
<< 1 pc SB 0.5% * Mc2 AGN 6-40% * Mc2 Hot dust Strong mid-IR (10-20um) emission (several 100K)
pure AGN HCN/HCO+ Starburst HCN/CO (Kohno astro-ph/0508420) J=1-0 Millimeter line ratio AGN and SB separated
Our NMA interferometric HCN/HCO+ survey Compared to single-dish obs.: Extract only nuclear emission Resolve multiple-nuclei HCN/HCO+ taken simultaneously
NMA NMA data Single nucleus LIRGs NGC4418 (Buried AGN) UGC5101 (Buried AGN) Mrk273 (Buried AGN) HCN > HCO+ HCN > HCO+ HCN > HCO+ Imanishi et al. 2004 AJ 128 2037 Imanishi et al. 2007 AJ 131 2888
NMA NMA data (II) Mrk 231 (type-1 AGN) IR08572+3915 (Buried AGN) HCN > HCO+ HCN > HCO+ Imanishi et al. 2007 AJ 134 2366
HCN < HCO+ HCN ~ HCO+ Imanishi & Nakanishi 2006 PASJ 58 813 Spatially resolve multiple components (1) Arp299
HCN < HCO+ HCN > HCO+ Spatially resolve multiple components (2) Mrk 266 Imanishi et al. 2008 in prep
E-nucleus W-nucleus Spectrally resolve multiple components Imanishi et al. 2007 AJ 134 2366 Spatially-unresolved
IR-buried -AGNs IR-Starburst NMA HCN/HCO+ ★:LIRGs HCN/CO
Interpretation High HCN/HCO+ in AGN • HCN abundance enhancement Meijerink et al. 2006 2. IR-radiative pumping enhance HCN flux
Molecular gas tau=1 sphere high abundance ρ∝r^-1.5 low abundance (Gierence et al. 1992) surface area flux abundance
HCO+/HCN HCO+/HCN high NH low NH HCN/HCO+ abundance: model dependent PDR XDR density=10^5.5 cm^-3 Meijerink et al. 2006
2. IR-radiative pumping enhance HCN flux HCN has a line at 14um Interpretation High HCN/HCO+ in AGN • HCN abundance enhancement Aalto et al. 1995
14um AGN is a strong IR 14um emitter (hot dust) Cascade HCN(1-0) 3.5mm IR radiative pumping Aalto et al. 1995 HCN has a line at 14um
HCO+ line at 12um is weak ! Not detected !
Summary NMA 3D (spatial and velocity) data : high HCN(1-0)/HCO+(1-0) ratios in nuclei of buried AGN candidates Imanishi et al. 2006 AJ 131 2888 Imanishi et al. 2007 AJ 134 2366 Imanishi et al. 2008 in prep
High-CR PDR XDR HCN(1-0)/HCO+(1-0) intensity ratio = high (in some parameter range) 10^4/cc Meijerink et al. 2006
optical Very compact starburst or AGN ? IR(12um) Soifer et al. 2000 ULIRGs Compact cores (<500pc) are energetically dominant
Outline 1. IR spectroscopy Select buried AGN candidate 2. Mm interferometric HCN(1-0) and HCO+(1-0) follow-up observation HCN(1-0)/HCO+(1-0) ratio
PAH 3.3um Bare 3.4um PAH 3.3um Ice 3.1um Bare 3.4um Subaru Buried AGN 3-4 um SB AGN+SB PAH strong (SB): Dust abs. weak PAH weak (AGN): Dust abs. strong
Spitzer GO1 5-35 um SB Buried AGN AGN+SB PAH PAH 18um 18um 9.7um 9.7um 9.7um PAH PAH 18um 18um 9.7um 9.7um 9.7um PAH strong: Silicate Abs. weak PAH weak: Silicate Abs. strong
★ AGN SB Exceptionally centrally-concentrated SB Very high surface brightness >>10^13Lsun/kpc^2 (SB max) Extreme SB? Remaining ambiguity
Interpretation High HCN/HCO+ in AGN • HCN abundance enhancement 2. IR-radiative pumping enhance HCN flux 3. Turbulence decreases HCO+ Papadopoulos 2007 Regardless of AGN or SB ? 4. High gas density
Interpretation High HCN/HCO+ in AGN • HCN abundance enhancement 2. IR-radiative pumping enhance HCN flux 3. Turbulence decreases HCO+ 4. High gas density N(crit): HCN ~ 5 * HCO+
HCN/HCO+ ★:(U)LIRGs XDR PDR HCN/CO High gas density scenario: unlikely ? ULIRG : low HCN/CO
NMA/RAINBOW data (III) Buried AGN AGN SB or AGN ? Imanishi et al. 2007 ArXiv/0709.1713
composite EW(PAH)<<100nm 1. Infrared spectral shape PAH PAHs are excited in starburst PDRs but destroyed near an AGN Buried AGN Starburst(SB) featureless 3.3um PAH EW(PAH)~100nm 3.4um/3.1um
ULIRG core <500pc Mixed dust model Foreground screen dustmodel 1-exp(-Tau) exp(-Tau) Tau Dust absorption feature: weak strong Tau(3.1) < 0.3 Tau(9.7) < 1.7 (Imanishi & Maloney 2003 ApJ 588 165) Tau(3.4) < 0.2 2. Dust absorption feature strength Buried AGN starburst
Buried AGN Av(3um) > Av(10um) > Av(20um) Starburst dust in edge-on host Av(3um) =< Av(10um) =< Av(20um) 3. Dust temperature gradient
Dust temperature gradient Optical depth Av(3um) ~110mag Av(10um) ~40mag Av(20um) ~20mag Subaru 9.7um 18um Spitzer How to detect T-gradient ?
Subaru Spitzer Strong T-gradient (II) Strong abs ULIRGs -> often show T-gradient
NLR 30% ULIRGs = optical Sy (AGN + torus) >50% ULIRGs = luminous AGN Results nearby(z<0.15) Opical non-Seyfert ULIRGs Luminous buried AGNs = 30-50%
NLR Amount of nuclear dust: Non-Sy >> Sy2 Our line-of-sight obscuration: Non-Sy >> Sy2 Sy2: Abs weak Non-Sy: strong L(dereddened AGN) ~L(IR)
Interpretation High HCN/HCO+ in AGN • HCN abundance enhancement 2. IR-radiative pumping enhance HCN flux 3. Turbulence decreases HCO+ 4. High gas density 5. CR-controlled chemistry Papadopoulos 2007 HCN/HCO+ < 1
NMA (RAINBOW) HCN/HCO+ ★:(U)LIRGs XDR IR-buried -AGNs IR-Starburst PDR HCN/CO Imanishi et al. 2006 AJ 131 2888; 2007 in prep
Optical Sy (non-)detectability depends on the amount of nuclear dust Summary 1. Buried AGNs : 30-50% non-Sy ULIRGs warm & cool 2. Nuclear dust amount: non-Sy ULIRGs > Sy2 ULIRGs Imanishi et al. 2006 ApJ 637 114 Imanishi et al. 2007 ApJS astro-ph/0702136
NLR warm larger dust column cool FIR color cool == starburst Buried AGNs: both warm/cool FIR colors pure buried AGN F25/F60=0.16(cool)