Download
1 / 5
50 likes | 71 Views
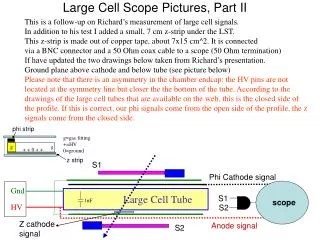
A follow-up on Richard's measurement of large cell signals with the addition of a small z-strip under the LST. The measurements show signal coincidence at both cathodes and the anode, with the anode signals being the largest. Further tests will include measuring pulse height spectra for each signal source and checking the HV dependency.

E N D
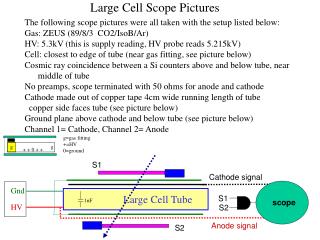
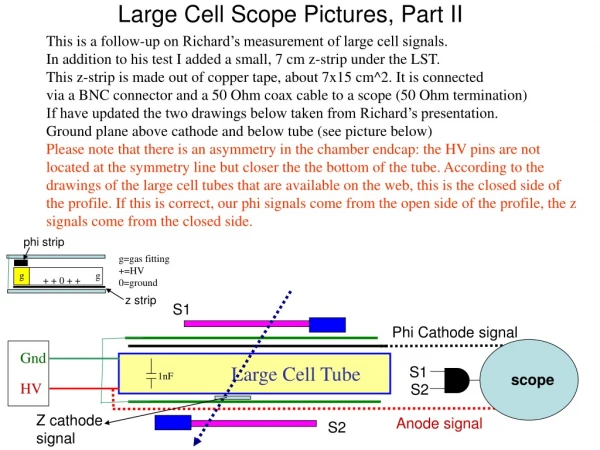
Large Cell Scope Pictures, Part II This is a follow-up on Richard’s measurement of large cell signals. In addition to his test I added a small, 7 cm z-strip under the LST. This z-strip is made out of copper tape, about 7x15 cm^2. It is connected via a BNC connector and a 50 Ohm coax cable to a scope (50 Ohm termination) If have updated the two drawings below taken from Richard’s presentation. Ground plane above cathode and below tube (see picture below) Please note that there is an asymmetry in the chamber endcap: the HV pins are not located at the symmetry line but closer the the bottom of the tube. According to the drawings of the large cell tubes that are available on the web, this is the closed side of the profile. If this is correct, our phi signals come from the open side of the profile, the z signals come from the closed side. phi strip g=gas fitting +=HV 0=ground g g + + 0 + + z strip S1 Phi Cathode signal Gnd Large Cell Tube S1 1nF scope HV S2 Z cathode signal Anode signal S2
Example 1: Anode at 20 mV, z at 10 mV and phi at 5 mV per division
Example 2: Anode at 20 mV, z at 10 mV and phi at 5 mV per division
Example 3: Anode at 20 mV, z at 10 mV and phi at 5 mV per division
Conclusion: • We see signal in coincidence at both cathodes and the anode • Anode signals are the largest. • Followed by the z strip signals (which we believe come from the closed side of the profile) which are about ½ the size of the anode signals. • The phi signals (which we believe come from the open side of the profile) are about ¼ the size of the anode signals. • Clearly this is not a complete test. The next step is to measure pulse height spectra for each signal source, check the HV dependency etc.