Download
1 / 13
141 likes | 315 Views
Dimensions of Statistical Literacy. 13 September 2006 UNECE Work Session on Dissemination and Communication. Statistical literacy is an ability. … to understand … to critically evaluate … to appreciate the contributions of statistical thinking According to Katherine Wallman.

E N D
Dimensions of Statistical Literacy 13 September 2006 UNECE Work Session on Dissemination and Communication
Statistical literacy is an ability ... • … to understand • … to critically evaluate • … to appreciate the contributions of statistical thinking • According to Katherine Wallman Statistics Finland / Jussi Melkas
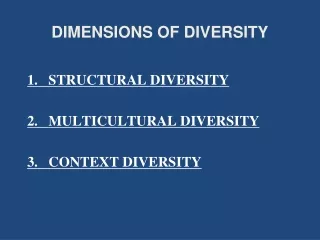
Elements of Statistical Literacy • Social and economic concepts • Inflation, unemployment rate, GDP, fertility, etc... • Statistical way of thinking • Statistical properties of mean & median, indices, growth rates, etc... • Knowledge of the research process • Samples, data gathering, questioning techniques, etc.. • Understanding of different presentation modes • Tables, graphics, text Statistics Finland / Jussi Melkas
Elements of Statistical Literacy, cont. • Imagination • capacity to see behind the numbers, connecting different sources • Carefulness • checking, checking, checking Statistics Finland / Jussi Melkas
NSI - problems in educating the public • Only small audiences compared to the need • Audiences are self-selected • Many target groups with differing needs • Exercises are difficult to organise (students’ lack of time, passivity, short courses) • Missing pedagogical capacity Statistics Finland / Jussi Melkas
System of statistical literacy promotion of ordinary people, Statistics Finland Statistics Finland ”Intellectuals” & Politicians Internet service Lecturing Lecturing National education system Teachers Agenda setting Ad hoc service Media Journalists Basic skills of statistical literacy Ordinary people Statistics Finland / Jussi Melkas
How can the NSI helpan ORDINARY PEOPLE’s understanding of statistics? • Their main source of daily statistical information is the media • A good web service is important, but it should also support understanding of statistics: • Present easy definitions linked to the statistical data! • Avoid difficult statistical terminology! • Tell how the information has been compiled! • Use standardised and clear graphics and tables! • Offer opportunities to exercise on the web! Statistics Finland / Jussi Melkas
How can the NSI supportthe JOURNALIST to succeed in the jungle of statistics? • Journalists are always in a hurry, have no time for theoretical problems, but always have time for discussion and questions • Personal contact supported with the web helps them best: • databank of concepts on the web • methodological information on the web • basic course on reading statistics (lectures, web) • ad hoc courses/seminars on up-to-date themes • ad hoc statistical support Statistics Finland / Jussi Melkas
How can the NSI supporta TEACHER to educate people to understand statistics • Teachers need a solid theoretical basis in statistical thinking, but also ready-made exercises • Teaching materials on the web and tailored lectures (multiform teaching) seem the best solution: • The NSI & education sector co-produce teaching materials • supporting material for tutoring of a student (e.g. how to find statistics, to make a sample, etc.) on the web • ready-made exercises on the web • databank of concepts on the web • easy to use models of graphics and tables on the web Statistics Finland / Jussi Melkas
How can the NSI try to get“INTELLECTUALS” to support the idea of statistical literacy? • The “intellectuals” are highly networked and they live within a continuous dialogue, but you cannot teach them • Networking is also the key for the NSI: • co-operation on data analysis • invitation to write into NSI publications • methodological seminars • good models of tables and graphics on the web and in printed publications • the NSI should take part in scientific discussion on relevant fields Statistics Finland / Jussi Melkas
Attachment • My presentation reflects the conditions of a small northern country and solutions found by Statistics Finland • Here are some basic facts about both of them Statistics Finland / Jussi Melkas
Finland • POPULATION: 5.26 million • LANGUAGE: 91% Finnish, 6% Swedish • GDP: EUR 155.3 billion, about EUR 30,000 per capita • EMPLOYMENT RATE: 68% • EXPENDITURE ON COMMUNICATION: EUR 942 per household • NEWSPAPERS: circulation 3.228 million copies • LIBRARIES: 2,333 million borrowers • INTERNET: 2.8 million users (aged 15-74) in spring 2006 • EDUCATION: 64% of total population completed at least upper secondary school Statistics Finland / Jussi Melkas
Statistics Finland • The National Statistical Office with about 1,000 employees • The tasks and autonomy defined by law • Services among others: • 700 releases of statistics in a year • the web service with 154,000 different visitors per month • eCourse in Statistics: 9 basic courses • 30 chargeable lecture courses in a year • 134 publications: among them three periodicals publishing analyses and statistics Statistics Finland / Jussi Melkas