Download
1 / 40
410 likes | 553 Views
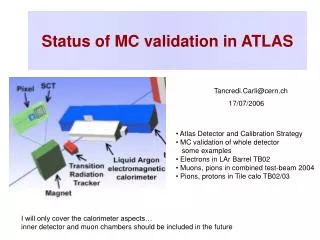
Status of MC validation in ATLAS. Tancredi.Carli@cern.ch. 17/07/2006. Atlas Detector and Calibration Strategy MC validation of whole detector some examples Electrons in LAr Barrel TB02 Muons, pions in combined test-beam 2004 Pions, protons in Tile calo TB02/03.

E N D
Status of MC validation in ATLAS Tancredi.Carli@cern.ch 17/07/2006 • Atlas Detector and Calibration Strategy • MC validation of whole detector • some examples • Electrons in LAr Barrel TB02 • Muons, pions in combined test-beam 2004 • Pions, protons in Tile calo TB02/03 I will only cover the calorimeter aspects… inner detector and muon chambers should be included in the future
HEC (Cu) TILE EMEC (Pb) FCAL (Cu,W) LAr Calorimeters: • em Barrel : (||<1.475) [Pb-LAr] • em End-caps : 1.4<||<3.2 [Pb-LAr] • Hadronic End-cap: 1.5<||<3.2 [Cu-LAr] • Forward Calorimeter: 3.2<||<4.9 [Cu,W-LAr] • ~190K readout channels • Hadronic Barrel: Scintillating Tile/Fe calorimeter
MC Validation • Detector geometry and test-beam set-up • (cables, electronics, air in beam-line) • Detector response: physics processes in detector • (charge collection in complicated E-fields, • recombination, photostatistics, light attenuation, • Birk’s law) • Electronic signal modeling and noise • 4)Physics processes: Interaction of particles with detector For the moment we are mostly busy with this… and start to work on 4) ATLAS plans (as baseline) to use the G4 MC for calibration of the detector We need a good MC ! How good ? …to be tested in Test-Beam
Dead Materials Correction and Hadronic Calibration • Atlas records “true” energy deposition in each calorimeter cell • and in hfgrid in dead material • Energy is split 4 types: e.m./non-e.m./invisible/escaped • Atlas plans to base dead material correction, electron calibration, hadronic weighting (e/p-compensation) on MC, if possible ! Example: Recover energy ‘lost’ between sub detector elements Example : The LAr-Tile crack Fraction of energy lost in dead materials 1.0 Recover energy from neighbouring active cells 0.8 0.6 Energy DM Energy DM/Beam 0.4 0.2 0.0 0.5 1.0 1.5 2.0 2.5 3.0 3.5 4.0 5.0 0.0 4.5
The E.M. ATLAS Calorimeter Lead/Liquid Argon sampling calorimeter with accordion shape : back >22 X0 middle Main advantages: LAr as act. material inherently linear Hermetic coverage (no cracks) Longitudinal segmentation High granularity (Cu etching) Inherently radiation hard Fast readout possible strips Presampler in front of calo up to = 1.8
electric field map recombination current drift velocity energy deposition high voltage Lar: Sensitive Detectors and Visible Energy Active volumes : readout cellssensitive detectors for Charge collection - + - + - + i(t) Rising time ~ 50 ns model E-field in accordion include the electronics response Signal is reconstructed as in data t
slant angle : 1º/~100º is sensitive Example: EM Endcapas “Detector as Built” f-modulations : Response to 120 GeV e-showers sagging EM calorimeter : Pb absorbers Peculiar accordion shape standard simulation + charge collection + gap adjustment Test Beam Data Recent efforts simulate an ‘as built detector’ : HV, sagging, misalignment, measured lead thickness, gap variations, charge collections, read-out electronics, cables etc. preliminary
EM EndCap Cell Response EM Endcap has complex geometry Cell reponse depends on eta High Voltage sectors Preliminary 2 % relative accuracy Global increase well reproduced by MC Preliminary Simulation vs Test Beam EMEC, 120 GeV electron Showers …still some work left !
Muon signal in the A cell fibre 70 p.e./GeV 50 p.e./GeV 25 p.e./GeV tiles A TileCal Module 64 Barrel 2x64 Ext. Barrel Scintillating Tile/Iron Calorimeter The TileCal Barrel Calorimeter • Recent improvements in MC: • Sampling fraction adjustement • electronic signal modeling and reconstruction • Photostatistics of photomultipliers • light attenuation between tile (work in progress) Example:
Test-Beams Outline: • H6: Combined end-cap test-beam: ECAL/HEC/FCAL • EM LAr Barrel TB02 • H8: combined barrel test-beam: full slice of ATLAS detector • Tile calorimeter standalone test-beam We have recently finished to incorporate consistently the simulation of All detectors and 2002-2004 test-beams in our software framework Athena Technical work is finished, more detailed MC/Data comparisons can start
HEC 1,2 EMEC FCAL 1,2 cryostat H6 Test-beam Set-up Front view: Side view: Beam Goal: calibrate complicated region with various dead material zones and 3 different calorimeters
Electrons (193 GeV): vertical scan x=0 sum • MC: Open squares; Data: solid points; FCAL1 EME2 MC: total energy! Data: 33 cluster! No correction! very preliminary cold cone EME3 Pion data being analysed Check and improve detector description in crack region
EM Barrel Test-Beam 2002 Test-beam 2002: Uniformity: 3 production modules h/f scan Linarity: E-scan 10 -245 GeV at eta=0.69 phi=0.28 thanks to special set-up to measure beam energy: linearity of beam energy known to 3 10-4 and a constant of 11 MeV (remnant magnet field)
Electron: Data/MC Comparison – Layer Energy Sharing Most difficult: correct description of DM material Band due to uncertainties in material estimation
Electron: Data/MC Comparison – Layer Energy Sharing Mean visible energy for245 GeV e- Deposited energies = f(h) in the PS and in the 3 calorimeter compartments before applying the correction factors Excellent Data / Mc agreement Data MC PS Strips Middle Back h
Electron: Data/MC Comparisons – Radial Extension First layer: MC uncertainty shown but not visible • We do not know why this • Is, can be • detector geometry ? • beam line ? distribution • of material ? • cross-talk ? • G4 physics problem ? • Good description • also for asymmetry Problems in tails at large energy Might be a problem for particle ID in Atlas
Electron: Data/MC Comparisons – Total Energy Need to fold in acceptance correction for electrons having lost large energy in „far“ material (from beam-line simulation) mean visible energy is reproduced within 0.1% (energy linearity) MC uncertainty contains variation of „far“ material
Electron: Data MC Comparison - Resolution Preliminary Phi-impact correction not applied Resolution is much better described in new G4 version ! G4.8 has completely revised multiple-scattering
electric field map recombination current drift velocity energy depositio high voltage Current to Energy Factor in ATLAS Barrel EM Calorimeter Preliminary G. Unal: ATLAS-SIM 09/05 Current nA From calculation using field-maps: Pb absorber From comparison of data and MC: electrode G4.8 gives much better understanding of absolute energy scale from first principles !
Current to Energy Conversion: Electron/Muon • ATLAS data calibrated with G4.7 • G4.8 visible energy increases • sampling fraction rises • fI/E is found to be lower when comparing visible energy in data and MC better agreement with first principle calculation and consistent with muon data (much less sensitive to low energy particles therefore G4.7=G4.8) Muons with E=150 GeV: very preliminary data MC See shift (~10%) Energy (MeV) in region: 0.4<eta< 0.48; |phi| < 0.04 G4.8 gives consistent picture for electrons and muons
Muon System MDT-RPC BOS Tile HCAL LAr EMC Tile HCAL TRT ATLAS Barrel Combined Test-beam 2004 Full -slice of ATLAS detector • Drift chambers: beam position • Scintillators: trigger • Calorimeters onmoving table • H8 beam: e, , , and p • Energy: 1 to 350 GeV
H8 G4 Simulation Setup A lot of effort went into modeling of beam-line “far” material: air, beam-windows etc. is being solved these days
MC distribution artificially shifted down by 4% (probably due to light attenuation) Need careful adjustment of muon impact point in simulation (must be same as in data) Sim CTB Muon: MC/CTB Comparison in Tile - Peak • 150 GeV run, ~80000 events • Energy in 3 samplings and tower very preliminary Generally quite good agreement 23
Generally quite good agreement up to highest energies Sim CTB Simulation includes: Ionisation, pair-production, Bremsstrahlung etc. Muon: MC/CTB Comparison in Tile - Tail • 150 GeV run, ~80000 events • Energy in 3 samplings and tower very preliminary 24
Muon: MC/CTB Comparison – Energy Dependence Tile Sampling 2 very preliminary • With increasing energy • radiative processes more and more important • MOP shifts, energy distribution widens • good description by G4.7 25
Pion: MC/CTB Comparison – E=20 GeV MC Data very preliminary MC: G4.7 QGSP describes data well (to be quantified)
Pion: MC/CTB Comparison – E=180 GeV MC Data very preliminary MC: G4.7 QGSP Shower starts and ends earlier in MC
Pion: MC/CTB Comparison – E=9 GeV MC Very Low Energy beam line very preliminary MC: G4.7 QGSP MC gives reasonable description of data
Pion: MC/CTB04 Comparison – E=3 GeV Very Low Energy beam line very preliminary Pion decays p m n MC: G4.7 QGSP Shower starts and ends earlier in MC …to be quantified
Pion: Tile TB02/03 (90 degree) Trick: By rotating calorimeter by 90 degree Tile Calorimeter is infinitely long (and has active/passive material orthogonal to beam as classical calorimeter) Test beam Particle entering in ATLAS Ideal device to study longitudinal shower shape very preliminary
Pion: Tile TB02/03 (90 degree) – Ratio MC/Data G4.7 QGSP QGSP: Shower starts and ends earlier very preliminary G4.7 LHEP LHEP: within 20% in first 8 interaction length strong energy dependence very preliminary
Proton: Tile TB02/03 (90 degree) -Ratio MC/Data QGSP very preliminary QGSP: Shower starts and ends earlier lhep LHEP: within 20% in first 8 interaction length strong energy dependence very preliminary
Conclusion Atlas has recently included all test-beam simulations in the software framework Athena Validation is needed for detector geometry, detector response and physics lists Since Atlas plans to base calibration on MC, a comprehensive validation of basic quantities and reconstruction algorithms are necessary G4 allowed to extract calibration constants to calibrate the electron with a linearity of 0.1% G4.8 gives better description of resolution and gives a more consistent picture for electrons and muons Description of pion is reasonable for low energy, but at high energy QGSP gives showers that start and end earlier For the Tile calorimeter LHEP is within +-20% up the 8 interaction length
Optimal Filtering Coefficients ADC MeV conversion ADC to GeV Pedestals response to current pulse pedestals and noise • All cells are pulsed with a known current signal: • A delay between calibration pulses and DAQ is introduced • The full calibration curve is reconstructed (Δt=1ns) • Cells are read with no input signal to obtain: • Pedestal • Noise • Noise autocorrelation (OFC computation) F = ADC2DAC DAC2A A2MeV fsamp Energy Raw Samples • Scan input current (DAC) • Fit DAC vs ADC curve with a second order polynomial, outside of saturation region Amplitude ( Energy) Pedestal subtracted The ionization signal is sampled every 25 ns by a 12 bits ADC in 3 gains. Energy is reconstructed offline (online in ROD at ATLAS). LAr electronic calibration Every 8 hours Every change of cabling Every 8 hours
Shower On the Calibration of longitudinally Segmented Sampling Calorimeter Samp.frac. depends on shower composition. Many short-ranged, low-energy particles are created and absorbed in the Pb (much higher cross-section for photo-electric effect in Pb than LAr) Sampl. fract. decreases with depth and radius as such particles become more and more towards the tails of the shower Use one sampling fraction for all compartments apply energy dependent correction
Final Calibration Formula Slope: energy lost by particles produced in DM (seeing effectively a smaller amount of dead material) in front of calorimeter Correction to sampling fraction in accordion: - intrinsic E-dependence of s.f. - I/E conversion - out-of-cluster correction Offset: energy lost by beam electron passing dead material in front of calorimeter +Eleak e+ Shower e- e- Dead Material Dead Material Presampler Accordion • Good linearity and resolution achieved • Constants depend on impact point (upstream material) and on the energy. • Can be parameterized. • Constants are derived from a MC simulation of the detector setup.
Linearity Result within 1% for 15-180 GeV, E=10 GeV 4 per mil too low, reason unclear…
Data/MC Comparisons – Layer Fractions E=10 GeV E=50 GeV • Fraction of under electron peak can be estimated by looking at late showers: E1/(E2+ E3) • Pions depositing most of energy in Lar deposit large fraction electromagnetically, • but shower later than electrons • f MC-pion + (1-f) MC-electron gives good description of MC • Effect of pion contamination on reconstructed energy can be estimated from • simulated energy distributions -> effect is negliable • shift of energy distribution with/without E1/(E2+ E3) is negliable
EM Barrel: Wheels Insertion P3 ATLAS endcap calorimeters installation, winter-spring 2006
EM Barrel: Wheels Insertion P3 M-wheel inside the cryostat, March 2003