Download
1 / 40
400 likes | 526 Views
CITY BLUEPRINTS Improving Implementation Capacities of Cities and Regions by sharing best practices on Urban Water Cycle Services. STATEMENT “ The water crisis is a crisis in governance.

E N D
CITY BLUEPRINTS Improving Implementation Capacities of Cities and Regions by sharing best practices on Urban Water Cycle Services
STATEMENT “The water crisis is a crisis in governance. We will promote better water governance arrangements and transparency, building on stronger partnerships between governments, civil society and the private sector.” Former Commission President Romano Prodi at the Johannesburg World Summit on Sustainable Development
THEME “The world is walking towards a crisis that it barely recognises. In scale and significance, it dwarfs all the others it is intricately connected with. This issue is water. As unbelievable as it sounds, we are running out of it and the window we have to solve this issue is narrow and rapidly closing. We will fail to feed the world until we fix the water crisis” Peter Brabeck-Letmathe, Chairman of the Board at Nestlé S.A.
URGENCY Competing demands for scarce water resources may lead to an estimated 40% supply shortage by 2030 (2030 Water Resources Group 2009). 2030 Water Resources Group (2009) Charting our water future. Economic framework to inform decision-making. West Perth, USA. http://www.mckinsey.com/App_Media/Reports/Water/Charting_Our_Water_Future_Full_Report_001.pdf.
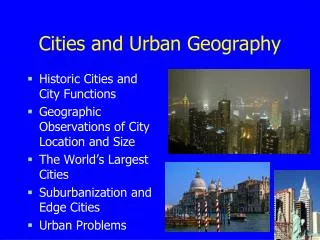
Cities are concentrated centers of production, consumption, and waste disposal that drive land change and a host of global environmental problems and are highly dependent on other cities and hinterlands to supply materials (including water), energy, and to dispose waste. Grimm et al., 2008. Science 319 (5864), 756-760. Bai, 2007. Journal of Industrial Ecology 11, 1-6. Engel et al., 2011. World Wildlife Fund, Germany.
URBANISATION Urban areas of the world are expected to absorb all the population growth expected over the next four decades. By 2050, urban dwellers will likely account for 86 % of the population in the more developed regions and for 64 % of that in the less developed regions SANITATION Currently, 2.5 billion people are without improved sanitation facilities. HUMAN HEALTH Currently, 3.4 million people - mostly children – die from water-borne diseases every year. CLIMATE CHANGE Climate change may worsen water services and quality of life in cities. HAZARDS Water-related hazards account for 90% of all natural hazards. WATER USE AND WATER SCARCITY Water withdrawals have tripled over the last 50 years. In 2030, there will be a 40% supply shortage of water.
WORLD ECONOMIC FORUM (2013) Recently, the World Economic Forum identified the water supply crisis as one of the top five global risks for both the impact and likelihood. This is caused by the decline in the quality and quantity of fresh water combined with increased competition among resource-intensive systems, such as food and energy production (World Economic Forum 2013).
MAKE URBAN INFRASTRUCTURES MORE SUSTAINABLE TO HELP DRIVE A GREEN ECONOMY An estimated US$ 41 trillion is required to refurbish the old and build new urban infrastructures over the period 2005–2030: • $22.6 trillion for water systems • $9 trillion for energy • $7.8 trillion for road and rail infrastructure • $1.6 trillion for air- and sea-ports 1 trillion means 1 thousand billions (1012) (Source: UNEP City-level decoupling, 2013)
GOVERNANCE: PEOPLE MATTER Governance has emerged as a concept in political science, sustainability science and other fields as a response to the growing awareness that governments are no longer the only relevant actors when it comes to the management of societal issues (Lange et al., 2013) As stated in the report of the European Green City Index (2009) about three-quarters of the existing technological changes that would help London to meet its long-term carbon reduction targets depended on the decisions of citizens or companies, not of governments. Public participation, i.e. the engagement of individuals with societies around them — or the strength of civil society in a city — has a strong link to environmental performance (seenextslide).
EARLY INVOLVEMENT OF STAKEHOLDERS SOURCE: ICLEI/SWITCH
WHY CITIES? THINK GLOBALLY, ACT LOCALLY 1. Cities are the major problem holders 2. Active civil societies incl. the private sector with visionary local government can cope with water challenges 3. It requires a bottom-up approach and collaboration among cities and regions by sharing best practices (communication on implementation)
TOWARDS TRANSITIONS OF CITIES URBAN WATER MANAGEMENT TRANSITIONS FRAMEWORK (SOURCE: BROWN ET AL. 2009)
PLANNING CYCLE ACCORDING TO SWITCH (MANAGING WATER IN THE CITY OF THE FUTURE) ICLEI/SWITCH
PROPOSED EIP WATER ACTION: FACILITATE STRATEGIC PLANNING AND IMPLEMENTATION 1. Baseline assessment (City Blueprint) 2. Inventory of best practices of cities 3. Blue City Website for sharing best practices and state-of-the art technologies applied in cities 4. Blue City Award (annual ceremony hosted by the EuropeanCommission) 5. Blue Friend labels for industries and their productscontributingtocost-effectiveimprovements in UWCS
ENERGY NEUTRAL WASTE WATER TREATMENT FACILITY IN THE CITY OF HAMBURG (GERMANY)
RESULTS FOR 11 CITIES/REGIONS There is a positive relation between the Blue City Index (BCI) and the: • Voluntary Participation Index (r = 0.727) • UWCS ambitions and measures (r = 0.904) • GDP according to IMF (r = 0.927) • Government effectiveness – World Bank (r = 0.927) • Number of Happy Life Years - Erasmus Univ. (r = 0.950) Where, r is the Pearson correlation coefficient
15 CITIES HAVE PARTICIPATED SO FAR (1ST OF JULY, 2013) Algarve (ALG; Portugal) Amsterdam (AMS; the Netherlands) Athens (ATH; Greece) Bucharest (BUC; Romania) Dar es Salaam (DAR;Tanzania) Hamburg (HAM; Germany) Kilamba Kiaxi (KIL; Angola) Oslo (OSL; Norway) Rotterdam (ROT; theNetherlands) Reggio Emilia (REG; Italy) Cities of Scotland (SCO;United Kingdom) Venlo (NL) Maastricht (NL) Melbourne (Australia) Ho Chi Minh City (Vietnam)
5. THE MOST IMPORTANT CONCLUSION: THE GREAT POTENTIAL OF SHARING BEST PRACTICES AMONG CITIES
IMPLEMENTATION MATTERS: THE RESULT OF COMBINING BEST PRACTICES IN 11 CITIES – BLUE CITIES
CONCLUSIONS 1. Megatrends (e.g. populationgrowth, pollution, climatechange) pose urgentwaterchallenges in cities. 2. The City Blueprint is a quick scan to benchmark UWCS. 3. City Blueprints can be used to communicate a city’s UWCS and select: • appropriate supply and sanitation strategies. • (non) technologicaloptions as futurealternatives. • measures for short-term and long-term investments. 4. The BCI correlates positively with the VPI, GDP, UWCS ambitions in cities, Government Effectiveness and Happy Life Years. 5. Cities are problem holders; they can learn from each other and become part of the UWCS solutions. 6. Blue friend labels for industries and their technologies and products that contribute to the improvement of UWCS. 7. Need for an EIP Action on Cities
NEXT STEPS 1. EIP-Water action on governance (City Blueprints) 2. Extension of work on European Cities (assessment of least another 10 cities in 2013) 3. Sharing best practices among cities 4. Workshop with EIP stakeholders (November) 5. Setting up a Blue City Website
CITY BLUEPRINTS Improving Implementation Capacities of Cities and Regions by sharing best practices on Urban Water Cycle Services EIP WATER ACTION GROUP PARTNERS NETWERC H2O (EU) – KWR WATER CYCLE RESEARCH INSTITUTE (THE NETHERLANDS) – FUNDACIÓ CTM CENTRE TECNOLÒGIC (SPAIN) - ADVENTECH(PORTUGAL) – COPERNICUS INSTITUTE OF SUSTAINABLE DEVELOPMENT (UNIVERSITY OF UTRECHT) – SIEMENS (THE NETHERLANDS) – ERRIN (EU) – RED ARAGON 7 PM (SPAIN) – ZINNAE (SPAIN) – AMGA (ITALY) – PARAGON EUROPE (MALTA) – USBMA (MOROCCO) – REGIONE PUGLIA (ITALY) – ACQUEDOTTO PUGLIESE (ITALY) – AUTORITA’ IDRICA PUGLIESE (ITALY) – DE MONTFORT UNIVERSITY (UNITED KINGDOM) –WITTEVEEN EN BOS (THE NETHERLANDS) – DELTARES (THE NETHERLANDS) – ENEA (ITALY) – REDINN (ITALY) - LEITAT (SPAIN) – DEMOWARE CONSORTIUM (EU) – WORLD BANK (THE USA) – REGIONETOSCANA (ITALY) – MINISTRY OF ENERGY AND WATER (STATE OF ISRAEL) – EASTON WATER CONSULTING (BELGIUM) PLEASE PARTICIPATE AND CONTACT US
CITY BLUEPRINTS Improving Implementation Capacities of Cities and Regions by sharing best practices on Urban Water Cycle Services POLITICAL COORDINATOR TECHNICAL COORDINATOR Richard Elelman Head of Public Administrations at Fundació CTM Centre Tecnològic and Administrative Director of NETWERC H2O Av. Bases de Manresa, 1. 08242 Manresa, Spain T +34 93 877 7373 F +34 93 877 73 74 M +34 608 54 55 28 E richard.elelman@ctm.com.es W www.ctm.com.es / www.netwerch2o.eu Skype: richardelelman Cornelis Johannes (Kees) van Leeuwen Chair Water Management and Urban Development Principal Scientist at KWR Watercycle Research Institute P.O. Box 1072, 3430 BB Nieuwegein The Netherlands T +31 30 6069617 F +31 30 6061165 M +31 652041795 E kees.van.leeuwen@kwrwater.nl W www.kwrwater.nl Skype: leeuwke47
ACKNOWLEDGEMENTS Most of the work has been carried out within the EU Research Project TRUST (Transitions to the Urban Water Services of Tomorrow). We would like to thank all collaborative teams involved the assessment of cities by completing the questionnaire for the baseline assessment and their feedback on earlier versions of this document: Helena Lucas, José Gascão, Joaquim Freire, Maria João Freitas, António Jorge Monteiro, Christos Makropoulos, Vittorio Di Federico, Thomas Giese, Kim Augustin, Niles-Peter Bertram,Ingrid Heemskerk, Paulien Hartog, Brian Sewbaks, Jadranka Milina, Rita Ugarelli, Paul Jeffrey, Heather Smith, George Ponton, Colin O’Neill,Gabriela Mercore, Daniel Goedbloed, António Jorge Monteiro and Philipo Chandy. I would also like to thank Marielle van de Zouwen, Jos Frijns, Theo van de Hoven, Peter Dane, Merijn Schriks, Nicoline Scholman, Rui Cunha Marques, Sveinung Sagrov, and the project leader of TRUST, i.e. David Schwesig for their major contributions to the work described in this manuscript. The European Commission is acknowledged for funding TRUST in the 7th Framework Programme under Grant Agreement No. 265122.
REFERENCES • Brown, R.R., Keath, N., Wong, T.H.F. ,2009. Urban water management in cities: historical, current and future regimes. Water Sci. Technol. 59,847–855. • European Green City Index 2009., Assessing the environmental impact of Europe’s major cities. A research project conducted by the Economist IntelligenceUnit. Siemens München, Germany. • Fleming, N., 2008. Understanding ‘what’s really going on’ as a basis for transforming thinking, action and our cities. Paper presented at Enviro08 Australasia’sEnvironmental & SustainabilityConference & Exhibition, Melbourne, Australia. • Lange et al., 2013. Governing towards sustainability—Conceptualizing modes of Governance. J. Environmental Policy & Planning 15.3:403-425. • TRUST: http://www.trust-i.net/ and http://www.trust-i.net/downloads/index.php?iddesc=68 • SWITCH: http://www.switchurbanwater.eu/ • Van Leeuwen, C.J., Frijns, J., van Wezel, A., van de Ven, F.H.M. 2012. Water ResourcesManagement 26:2177-2197. • Van Leeuwen, C.J., Chandy, P.C. 2013. The city blueprint: experiences with the implementation of 24 indicators to assess the sustainability of the urban water cycle Water Sci. Technol.: Water Supply 13.3: 769-781. PHOTOGRAPHS: Philip, R. et al., Module 1 - StrategicPlanning & Anton, B. et al., Module 2 - Stakeholders, SWITCH Training Kit: IUWM in the City of theFuture, publishedby ICLEI European Secretariat (2011) - www. switchtraining.eu.