Download
1 / 8
80 likes | 154 Views
Why enincon‟s report upon “ Power Distribution Tariffs in India 2018â€<br>With power distribution reforms gained momentum soon after the application of EA 2003 (where it was believed to be coined in mid 90‟s) , Indian power distribution utilities came along way since then. With, introduction of reforms and multiple cognitive steps undoubtedly the power distribution sector stands improved by leaps from the erstwhile levels. Having said that, it indeed still represents the weakest link of the power generation, transmission and distribution chain

E N D
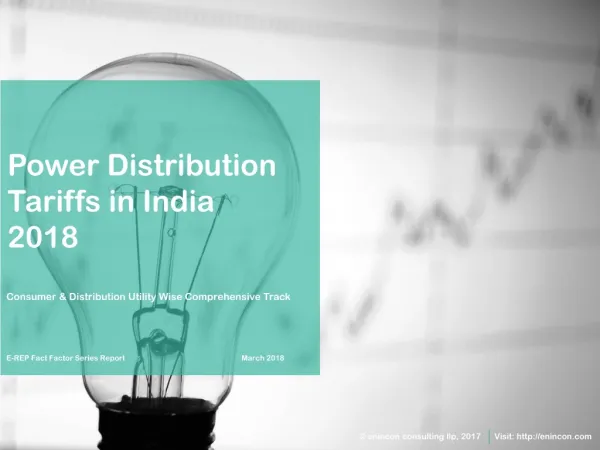
Power Distribution Tariffs in India 2018 Consumer & Distribution Utility Wise Comprehensive Track E-REP Fact Factor Series Report March 2018 © enincon consulting llp, 2017 Visit: http://enincon.com
Why enincon‟sreport upon “ Power Distribution Tariffs in India 2018” UDAY SCHEME AGRUABLY POSITIVE, BUT CHALLENGE REMAINS IN LATENT POWER DEMAND ESTIMATES WHICH HINTER THE SECTOR GROWTH With power distribution reforms gained momentum soon after the application of EA 2003 (where it was believed to be coined in mid 90‟s) , Indian power distribution utilities came along way since then. With, introduction of reforms and multiple cognitive steps undoubtedly the power distribution sector stands improved by leaps from the erstwhile levels. Having said that, it indeed still represents the weakest link of the power generation, transmission and distribution chain. With, India having most of the discoms run as state authorities the pedigree for operational efficiencies and achievement of targeted revenue remains a seldom site. Barring Gujarat and few discoms of southern states the degree of AT&C loss levels decline over the past decade remains elusive. For sure, states like Rajasthan , Madhya Pradesh and Maharashtra have depicted remarkable improvement but still owing to the large area of operations and the consumer handled thereof consistently tests the revenue cycle for the utilities. The energy sector in India has witnessed a transformational change with progressive policy-level changes and effective implementation of directives. Since, the present government came into force, some drastic developments have taken place in the power sector: • In April, 2017 power deficit stood at lowest ever of 0.5%. Also, the energy shortage was as low as 0.1 per cent each in Western, Southern and Eastern region. However, the North Eastern region has reported energy shortage of 4.5 per cent. It was 1.5 per cent in the Northern region. • The average per unit cost for power procured by the Railways dropped to ₹6 in 2016-17 against ₹6.75 in 2015- 16. Also, Indian Railways is pushing for direct power procurement route through open access. • UDAY scheme was touted as the next paladin to bail out the struggling Discoms, in order to turn them green in a time horizon of 3-4 years from 2015/16. Though was optional for the states, as of now 27 States/UTs are on board and INR 2,32,163 Crore of bonds have been issued which accounts for 85% of the debt to be restructured under this scheme. As of now, state power distribution companies have started reporting substantial savings and improvements in operational efficiency. Utilities in Rajasthan, Haryana, Chhattisgarh and Punjab are among the major gainers on account of lowering their interest cost. © enincon consulting llp, 2017 Visit: http://enincon.com
Having said that, complexity of power sector is such that disconcerting challenges remain. The demand projections made by discoms are based on actual units consumed and a projected rate of growth of demand for each category of customer, based on past trends. They are made assuming the limitations of the existing distribution/transmission network. The latent demand from a population, is left without service by the existing network, or from areas provided limited energy due to network limitations, do not figure in the demand projections. Another issue with the demand projections is that the power distribution utilities, due to flawed methodologies are not accounting the actual power consumption correctly, courtesy the faulty metering status and impairments arising due to improper feeder segregation. For example, agricultural consumers due to their flawed equipment labelling happened to consume more power at either no cost or heavily subsidised cost which goes unmeasured and holds a critical factor in terms of aggregating the demand, needless to mention India being an agrarian economy. Discoms by and large are not transparent about the power cuts they impose and the power outages due to faults, making independent estimation of the „unconstraineddemand‟ (the likely demand), in the absence of power outages, very difficult. All these above mentioned pointers makes it difficult to exactly access the power demand scenario and hence planning for the same becomes difficult. This irregularity in proper demand planning reflects in ARR filings, directly impacting the power tariff of the state. Few other challenges which pose major threat to the distribution tariff scenario in India are: • Complexity of tariff schedules • Average tariffs in some cases are set below the average cost of supplying electricity • High Industrial tariffs and variable quality of electricity adversely effecting industrial growth • Price and non price barriers come in way of single nationwide electricity prices through open access • Determination of progressive tariff schedules for domestic consumers In this regard there is a need for a dossier which attempts to make a few analytical observations that are relevant for the states, their regulators and other stake holders listing various components which goes into tariff computation of different consumers as per their respective distribution utilities. © enincon consulting llp, 2017 Visit: http://enincon.com
WESTERN REGION POWER DISTRIBUTION TARIFF - GUJARAT INFOGRAPHIC - 2017 General Information Power Situation - Facts Gross Employee Cost 44% UGVCL Region 135000 It is pertinent to note that the state faced power surplus of 4.2% and 4.2% during peak and normal hours respectively in FY 16-17 120000 105000 Million Units PGVCL Region 90000 75000 Demand 2017 2018 60000 DGVCL Region Supply 45000 30000 Actual Cost Approved Cost FY 16-17 Approved Cost FY 17-18 MGVCL Region 15000 43% 0 Actual Peak Power Distribution in Gujarat is managed by UGVCL, PGVCL, DGVCL & MGVCL in Northern, Western, Southern & Central region respectively Connected Load* Tariff Revenue / Net ARR & Revenue Gap/Surplus Agricultural Domestic Other Consumers Tariff Revenue Net ARR Revenue Gap/Surplus Consumer Profile* 2.4% Commercial 45000 40000 Industrial INR. Crores 35000 30000 Industrial Agricultural 25000 Commercial 20000 Other Consumers include Public Water Works, Street Light and Railway Traction 15000 10000 3% -2.1% 5000 Consumer Category Wise Revenue Contribution* 0 Domestic FY 2016-17 FY 2017-18 Agricultural Consumer Numbers Industrial The Commission (GERC) decided to keep the tariffs of state-owned power distribution companies unchanged for 2017-18 for all consumers. Gujarat Electricity Regulatory ` 16% 9% 10.60 Mn 0.085 Mn 1.286 Mn 1.573 Mn 0.4% 72% Domestic Commercial *Non – RGP & LTMD consumers are considered under Industrial Consumers Head and GLP category consumers are considered under Commercial category consumers Other Consumers: 2.6%
BUSINESS CASE FOR POWER DISTRIBUTION TARIFFS IN INDIA • Thrust given to add power generation capacity (Renewable and Thermal): A move to create "one market in power“ • Long overdue reforms of Discoms taking shape • Energizing the development of Renewable Sector • The new paradigm of surplus power sets the stage for new reforms • Move to make tariff structure more simple • High tariffs and erratic supply for industry have led to a slow but steady decline in the growth of industrial electricity purchases from utilities and a gradual transition towards captive generation. • Push to “Make in India” initiative • Push to allow Open Access on large scale REPORT INSIGHTS • Distribution Utility wise tariff schedule in India applicable for FY 2018-19 • Applicable Tariff Sheet for each distribution utility and types of consumers applicable for FY 2018-19 • Charts and Analysis for each Distribution Utility • Old vs New Tariff Comparison (Last 1 year regulatory track of change in applicable surcharges and duties) • Easy to use Excel and Pdf Format KEY HIGHLIGHTS • Consumer category wise tariff schedule for FY 2018-19 • Consumer profiling as per connected load • Consumer category wise revenue contribution • Net Aggregate Revenue Requirement (ARR) of Distribution Utilities • Revenue Gaps/Surplus for Distribution Utilities © enincon consulting llp, 2017 Visit: http://enincon.com
PRESS EXCERPTS Government plans to rationalise power tariffs: The idea is to have similar categories and sub categories of power consumers in all states, thereby trying to minimise the tariff categories Economic Times, India Developers are “wakingup” to the reality and the scenario may improve. But that will only solve part of the problem. For the situation to improve, power distribution companies should get their finances in order. That will reduce counter-party risks and ensure competitive power tariffs for consumers. Mercom Capital KEY QUERIES ADDRESSED • What is the key rationale behind tariff calculation for FY 2018-19? • What is the consumer profiling of the state? • What is the consumer category wise tariff structure? • What is the actual power situation of the state? • What is the actual connected load among various consumers? • What is consumer category wise revenue contribution? • What is the Net ARR of the distribution utilities? • How much is the net gap/surplus for distribution utilities? © enincon consulting llp, 2017 Visit: http://enincon.com
MUST BUY FOR • Power Generating Companies • Power Distribution Utilities • Power Transmission Utilities • Captive/Group Captive Consumers • Independent Power Producers • Bulk Consumers • State Electricity Regulatory Authorities • FIIs/Banks • Industrial Park/SEZs/Steel Plants • Government Agencies WHAT YOU CAN LEARN ? A SNAPSHOT • Northern Region Power Distribution Tariff for FY 2018-19 • Western Region Power Distribution Tariff for FY 2018-19 • Eastern Region Power Distribution Tariff for FY 2018-19 • Southern Region Power Distribution Tariff for FY 2018-19 • North Eastern Region Power Distribution Tariff for FY 2018-19 • Power Distribution Tariff Applicable for Domestic Consumers for FY 2018-19 • Power Distribution Tariff Applicable for Commercial Consumers FY 2018-19 • Power Distribution Tariff Applicable for Agricultural Consumers FY 2018-19 • Power Distribution Tariff Applicable for Industrial Consumers FY 2018-19 • Power Distribution Tariff Applicable for Other Bulk Consumers FY 2018-19 • Power Distribution Tariff Applicable for Railways/MRTS FY 2018-19 © enincon consulting llp, 2017 Visit: http://enincon.com
join the Future now Order Form Pricing Options Report (Hard Bound) $ 1299 Report Electronic Version (Single User License) $ 1099 Report Electronic Version (Corporate License) $ 1699 Note: TDS will not be deducted. In case of payments to be made in USD, Euro, GBP the conversion rates on the date of purchase will be applicable. Making the Payment • • Payment in Indian Rupees (INR): We accept Cheques / Demand Draft. However, we prefer payment through RTGS. Beneficiary ENINCON CONSULTING LLP Account No. 9512307881 IFSC Code KKBK0000204 MICR Code 110485031 Name of Bank Kotak Mahindra Bank Address Kotak Mahindra Bank Ltd. A-312 , Janakpuri , New Delhi - 110058 Payment through Cheques / Demand Draft: Payment should be made in favour of “ENINCON CONSULTING LLP” through Cheques / DD payable at New Delhi (or 'at Par' Cheques) and send it to the below mentioned address. Key Contacts For Sales & Support Ruchika Motwani ruchika.motwani@enincon.com +91 11 65021200 For Research & Consulting Ravi Shekhar rv@enincon.com +91 11 46579411 Worldmark 2 I Aerocity I New Delhi - India Phone I +91 11 65021200 Email connect@enincon.com For more details, visit http://enincon.com/store/