Download
1 / 19
190 likes | 204 Views
EPA Region 10 STORET Web Services & Superfund WQX Data Flow. Sue McCarthy mccarthy.sue@epa.gov. Matt Gubitosa gubitosa.matt@epa.gov. Region 10 Office of Environmental Assessment Environmental Characterization Unit. Region 10: STORET 2007 User’s Conference. Region 10 and STORET.

E N D
EPA Region 10STORET Web Services&Superfund WQX Data Flow Sue McCarthy mccarthy.sue@epa.gov Matt Gubitosa gubitosa.matt@epa.gov Region 10 Office of Environmental Assessment Environmental Characterization Unit Region 10: STORET 2007 User’s Conference
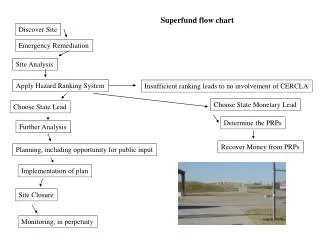
Region 10 and STORET • Regional Superfund Instance of STORET www.storet.org • WebSIM • Web Mapping Application (ARCIMS) • Tabular & Map Query Tools • Superfund Data Flow: recently completed a migration template from the CLP into WebSIM for inorganics (SEDD to WQX template) Region 10: STORET 2007 User’s Conference
Introduction • Examples of Region 10 Uses for STORET Web Services • Mapping STORET Stations: Generation of Input Formats for Virtual Earth, Google Earth, and ESRI Desktop and Server Products • Get STORET Results via Map Applications • Suggestions for Future Web Services • Superfund Data Flow into WQX Region 10: STORET 2007 User’s Conference
CONVERT XML or GeoRSS Virtual Earth Storet GetStations Lat -Long Request KML Google Earth SDE Storage ESRI Products Mapping STORET Stations: GetStations Request Region 10: STORET 2007 User’s Conference
Convert STORET getStations Results STORET to KML Stylesheet Which Outputs KML File XML Load to ESRI SDE Database All Fields Storet GetStations Request XML Output File STORET to GeoRSS Stylesheet which Outputs geoRSS File Program can be scheduled to run against the Web Service Region 10: STORET 2007 User’s Conference
Unformatted XML Storet GetResults Web Service Request for Station Data Station Click Formatted XML STORET Station Results: getResults Request Interactive Requests to the getResults Web Service Region 10: STORET 2007 User’s Conference
To Stimulate Further Demand for WQX/STORET in Region 10 • Regional managers/scientists want • map tools that allow display of contaminant concentrations directly on maps • data that they can incorporate into statistical analysis, modeling, and reporting • Web Services that return pertinent data which can be easily used • Suggestions for additional web services Region 10: STORET 2007 User’s Conference
Suggestions: Three Additional Web Services • Proposed Web Service One: Addition to the STORET Result Web Service • User Input Parameters: latitude-longitude bounds • Web Service Output: characteristic results for all stations within the lat-lon bounds • Example Uses: Interactive query from a map or query form; also for intermittent data downloads Region 10: STORET 2007 User’s Conference
Example of Use for Proposed Web Service OneSelect multiple stations directly from a map interface with a latitude longitude bounding box Region 10: STORET 2007 User’s Conference
Suggestion #2: Three Additional Web Services • Proposed Web Service Two: Combination of getStations and getResults Web Services • User Input Parameters: latitude-longitude bounds, selected characteristics • Web Service Output: Station info (including location) and characteristic results • Example Uses: • Map contaminant levels at station locations: symbolize stations with contamination above action levels (10x a criteria for example) • Analyze data via a mapping interface: identify problem contaminants, areas, or media • Incorporate data into models – (for example: surface water, groundwater, or statistical models) Region 10: STORET 2007 User’s Conference
Proposed Web Service Three: Creation of a STORET/WQX Spatial (Mapping) Data Service Web Mapping Service (WMS) ESRI ARCGIS Feature Service (GISServer or ARCIMS) Suggestion #3: Three Additional Web Services
Superfund Data Flow into WQXRegion 10 as a Data Generator • Region 10: Number of Samples for 2006 • Contract Lab Program (CLP) • 1,398 Organic, 20,484 Inorganic • Region 10 Lab in Manchester • 5,000 Total (Organic and Inorganic) • EPA’s Analytical Services Branch • http://www.epa.gov/superfund/programs/clp/index.htm
Region 10 Superfund Data Flow into WQXContract Lab Program Lab SEDD Forms2 LITE SMO Inorganics R10 Deliverable mapped to WebSIM R10 Deliverable SEDD/F2L mapped to WQX Region 10: STORET 2007 User’s Conference
Summary • STORET Web Services are a great start, we want more! • Additional services are necessary to facilitate data analysis and decision making • Anticipated high visibility use of these services will increase future WQX utilization • Superfund Data Flow to WQX • Is there demand for mapping the SEDD format to WQX? Region 10: STORET 2007 User’s Conference
Virtual Earth Example Region 10: STORET 2007 User’s Conference
Google Earth Example Region 10: STORET 2007 User’s Conference
ARCGIS Server Example Region 10: STORET 2007 User’s Conference
getResults Example Region 10: STORET 2007 User’s Conference
Superfund Data Flow into WQX via the Superfund Analytical Services Contract Lab Program • 2006 CLP LABS • 70,758 Total Inorganic (Metals) Analyses • 46,859 Total Organic Analyses • Since Inception in 1980 CLP Labs > 2,900,000 samples • http://www.epa.gov/superfund/programs/clp/index.htm EPA Analytical Services Branch • Region 10 Manchester Lab (Superfund and non-Superfund) • 2006 ~ 5000 samples and 11,000 analyses