Download

1 / 21
210 likes | 304 Views
Ten-year trends in obesity among schoolchildren in the Ashkelon District of Israel: 1990-2000. Michael Huerta, MD, MPH 1 , Michael Gdalevich, MD, MPH 1,2 , Jacob Haviv, MD, MPH 1 , Haim Bibi, MD 3 , Shimon Scharf, MD, MPH 1.

E N D
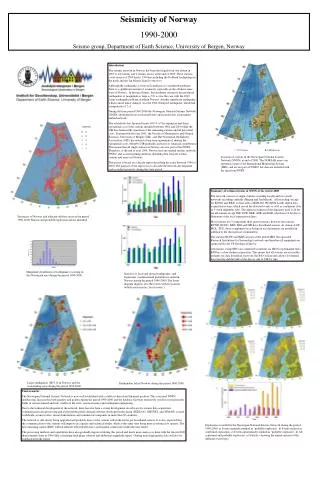
Ten-year trends in obesity among schoolchildrenin the Ashkelon District of Israel: 1990-2000 Michael Huerta, MD, MPH1, Michael Gdalevich, MD, MPH1,2, Jacob Haviv, MD, MPH1, Haim Bibi, MD3, Shimon Scharf, MD, MPH1 1District Health Office, Ben-Gurion University of the Negev–Barzilai Medical Center Campus, Ashkelon2Department of Epidemiology, Sackler Faculty of Medicine, Tel-Aviv University 3Department of Pediatrics, Carmel Medical Center, Haifa Published as: Huerta M, Gdalevich M, Haviv J, Bibi H, Scharf S. Ten-year trends in obesity among Israeli schoolchildren: 1990-2000. Acta Paediatrica 2006 April;95(4):444-449. 1
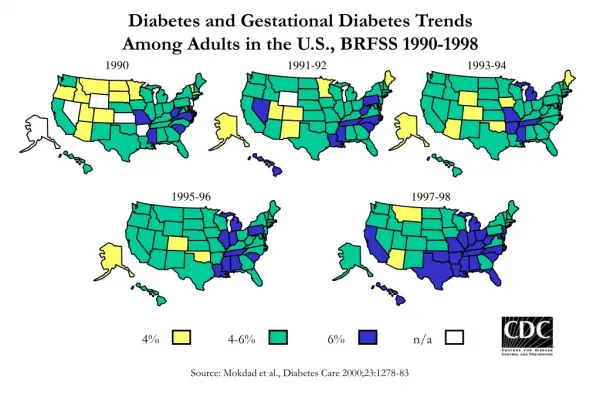
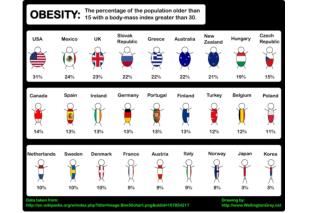
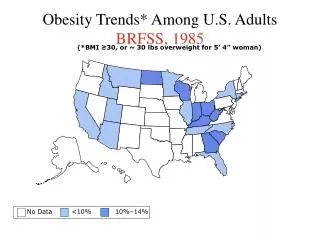
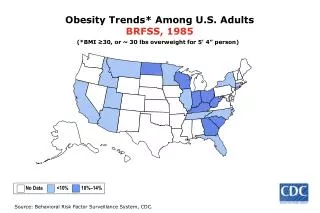
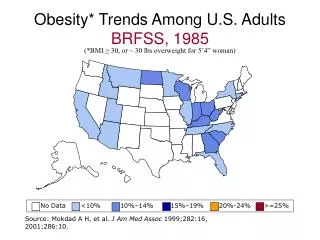
Background • In the US, 95th centile of BMI-for-age-and-sex is recommended as the cutoff point for definition of childhood overweight • BMI-for-age charts published by the US CDC in 2000 provide current reference values, but those shown for children aged ≥6 are based on data collected in 1963-1980 • US reference values are of limited validity for international use, due to cultural, demographic and nutritional differences between countries • Additional means of monitoring BMI trends must be used outside the US, such as comparison to historic references in the local population 2
Objectives • To analyze trends in childhood BMI measurements in the Ashkelon District of Israel between 1990-2000 • To assess the proportion of obese children using bothUS and population-specific historic reference values 3
Methods • Study district includes cities of Ashkelon, Ashdod, Kiryat Gat, Kiryat Malachi, Sderot and surrounding agricultural settlements • Data collected in four cross-sectional, school-based health surveys: 1990, 1994, 1997 and 2000 • Random cluster sampling of schools, aimed at 2nd and 5th graders • Weight and standing height calculated for 13,284 children 4
Methods • Mean, median and 95th centile of BMI values in 1990, stratified by sex and age, were taken as baseline historic references. • Calculated proportion of subjects in subsequent surveys with BMI values above population-specific 1990 references. • Calculated proportion of subjects in subsequent surveys with BMI values above 95th centile of CDC/NCHS BMI-for-age charts. • Calculated odds ratio for obesity among children in 2000, compared to children in 1990. 5
Table 1: Characteristics of study component samples, 1990-2000 6
1990 2000 Distribution of BMI values among 2nd grade boys, 1990 vs. 2000 2nd grade boys % BMI 7
1990 2000 Distribution of BMI values among 2nd grade boys, 1990 vs. 2000 2nd grade boys % BMI 7
2nd grade boys 2nd grade girls 95th centile BMI values among 2nd graders, by sex and year 9
12.7% increase 11.8% increase 2nd grade boys 2nd grade girls 95th centile BMI values among 2nd graders, by sex and year 9
12.7% increase 11.8% increase 2nd grade boys 2nd grade girls 95th centile BMI values among 2nd graders, by sex and year 9
5th grade boys 5th grade girls 95th centile BMI values among 5th graders, by sex and year 10
10.2% increase 8.4% increase 5th grade boys 5th grade girls 95th centile BMI values among 5th graders, by sex and year 10
10.2% increase 8.4% increase 5th grade boys 5th grade girls 95th centile BMI values among 5th graders, by sex and year 10
Table 2: Proportion of obese children, by age, sex, year and BMI cutoff value 11
Table 3: Proportion of subjects in 1990 and 2000 with BMI > 1990 reference values, by age and sex Grade Sex BMI at 95th centile Proportion (%) over Odds ratio* P value (1990 component) reference BMI value 1990 2000 19.20 5.0 11.4 2.40 (1.49 - 3.97) <0.001 nd 2 Boys Girls 19.22 5.0 11.4 2.47 (1.57 - 4.02) <0.001 th 5 Boys 21.88 5.0 10.7 2.27 (1.38 - 3.86) <0.001 Girls 22.60 5.0 11.1 2.32 (1.47 - 3.81) <0.001 Odds (child’s BMI in 2000 exceeds 1990 reference value) * OR = Odds (child’s BMI in 1990 exceeds 1990 reference value) 12
Summary of results • Distribution of BMI values in 2000 was skewed to the right compared to the distribution of values in 1990 • Little or no change was observed in mean and median BMI values, but obese children became heavier over time • There was a monotonous increase over time in BMI values at the 95th centile. BMI values at the 95th centile increased by 8.4%-12.7% between 1990 and 2000 • US reference values published by CDC in 2000 did not accurately describe observed Israeli population values • In 2000, the odds of a child being obese based on historic cutoff values were more than double those of a child one decade earlier 13
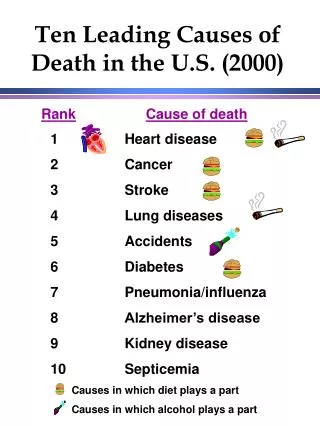
Conclusions • Although little change was noted in mean and median BMI-for-age values between 1990-2000, the severity of overweight increased with time, as the heaviest children consistently got heavier • Similar results have been observed in the US pediatric population between the 1960’s and the 1990’s • This is most likely the result of increased environmental effects over time on the segment of the population most susceptible to obesity 14
Conclusions • Israeli 1990 reference values were “stricter” than US reference values, and classified more children as obese, due to the higher prevalence of obesity in US compared to Israel • From 1990-2000, the prevalence of obesity in US children aged 6-11 increased from 11.3% to 15.3%. Using identical US cutoff points, obesity in Israeli children of comparable ages increased threefold, from 2.3% to 6.9% • US children are more obese than their Israeli counterparts, but the latter appear to be rapidly closing the gap 15