Download
1 / 14
140 likes | 286 Views
Validity and Reliability. Will G Hopkins (will@clear.net.nz) Sport and Recreation AUT University. This slideshow is a shortened version of the slideshow in: Hopkins WG (2004). How to interpret changes in an athletic performance test. Sportscience 8, 1-7. See link at sportsci.org.

E N D
Validity and Reliability Will G Hopkins (will@clear.net.nz)Sport and RecreationAUT University • This slideshow is a shortened version of the slideshow in: • Hopkins WG (2004). How to interpret changes in an athletic performance test. Sportscience 8, 1-7. See link at sportsci.org. • Other resources: • Hopkins WG (2000). Measures of reliability in sports medicine and science. Sports Medicine 30, 1-15. • Paton CD, Hopkins WG (2001). Tests of cycling performance. Sports Medicine 31, 489-496. • Hopkins WG (2010). A Socratic dialogue on comparison of measures. Sportscience 14, 15-21. See link at sportsci.org. • My spreadsheets for analysis of validity and reliability. Also minor articles. See links at sportsci.org.
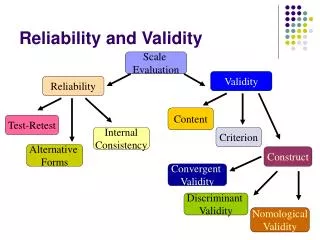
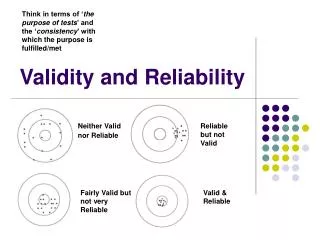
Definitions • Validity of a (practical) measure is some measure of its one-off association with another measure. • "How well does the measure measure what it's supposed to?" • Concurrent vs convergent validity: the other measure is a criterion (gold-standard) vs something that ought to be related. • Important for distinguishing between individuals. • Reliability of a measure is some measure of its association with itself in repeated trials. • "How reproducible is the practical measure?" • Important for tracking changes within individuals. • High reliability is necessary but not sufficient for high validity. • That is, you can measure something wrong reliably! • And if you measure it right, it must be reliable.
Criterionbody fat(%BM) Practical body fat (%BM) Validity • We can often assume a measure is valid in itself… • …especially when there is no obvious criterion measure. • Examples from sport: tests of agility, repeated sprints, flexibility. • If relationship with a criterion is an issue, usual approach is to assay practical and criterion measures in 100 or so subjects. • Fitting a line or curve provides a calibration equation, the error of theestimate, and a correlation coefficient. • These apply only to subjects similarto those in the validity study. • Preferable to Bland-Altman analysis. • Limits of agreement (= ±1.96 SDof difference scores) do not allow proper assessment of error. • B-A plot of difference vs mean scores usually indicates a systematic offset error (“proportional bias”) when in reality there is none. r = 0.80
Beware of units of measurement that lead to spurious high correlations. • Example: a practical measure of body fat in kg might have a high correlation with the criterion, but… • Express fat as % of body mass and correlation = 0! • So the measure provides no useful information. • For many measures, use log transformation to get uniformity of error of the estimate over the range of subjects. • Check for non-uniformity in a plot of residuals vs predicteds. • Use the appropriate back-transformation to express the error as a coefficient of variation (percent of predicted value). • The error of the estimate is the "noise" in the prediction. • Ideally, noise < “signal”. • The signal is the smallest important difference between subjects. • Default = 0.20 of between-subject standard deviation (Cohen). • But r2 = "variance explained" = (SD2-error2)/SD2. • So if noise < signal, error < 0.20*SD. • It follows that ideally r > 0.98! Much higher than people realize.
Uses of validity • “Calibration” of a practical measure. • The regression line between the criterion and the practical measure converts the practical into an unbiased estimate of the criterion. • The standard error of the estimate is the random error in the calibrated value. • Adjustment of effects in studies involving the practical measure (“correction for attenuation”). • If the effect is a correlation, it is attenuated by a factor equal to the validity correlation. • If the effect is slope or a difference or change in the mean, it is attenuated by a factor equal to the square of the validity correlation. • BEWARE: the calibration and adjustments apply only to subjects drawn from the population used for the validity study. • Otherwise the validity statistics themselves need adjustment. • I have developed as yet unpublished spreadsheets for this purpose.
Reliability • Reliability is reproducibility of a measurement if or when you repeat the measurement. • It's important for practitioners… • because you need good reproducibility to monitor small but practically important changes in an individual subject. • It's crucial for researchers… • because you need good reproducibility to quantify such changes in controlled trials with samples of reasonable size.
Subject Trial 1 Trial 2 Trial 3 Trial 4 Trial 5 Trial 6 Mean ± SD Chris 72 76 74 79 79 77 76.2 ± 2.8 • How do we quantify reliability?Easy to understand for one subject tested many times: • The 2.8 is the standard error of measurement. • I call it the typical error, because it's the typical difference between the subject's true value and the observed values. • It's therandom error or “noise” in our assessment of clients and in our experimental studies. • Strictly, this standard deviation of a subject's values is the total error of measurement rather than the standard or typical error. • It’s inflated by any "systematic" changes, for example a learning effect between Trial 1 and Trial 2. • Avoid this way of calculating the typical error.
Subject Trial 1 Trial 2 Trial 2-1 Chris 72 76 4 Jo 53 58 0 Kelly 60 60 -2 Pat 84 82 6 Sam 67 73 2.6±3.4 Mean ± SD: • We usually measure reliability with many subjects tested a few times: 5 • The 3.4 divided by 2 is the typical error. • The 3.4 multiplied by ±1.96 are the limits of agreement. • The 2.6 is the change in the mean. • This way of calculating the typical error keeps it separate from the change in the mean between trials.
90 Pearson r = 0.95 Trial 2 70 Intraclass r = 0.95 50 50 70 90 Trial 1 • And we can define retest correlations:Pearson (for two trials) and intraclass (two or more trials). • These are calculated differently but have practically the samevalues. • The typical error is moreuseful than the correlationcoefficient for assessingchanges in a subject.
Uses of reliability: monitoring change in an individual… • Think about ± the typical error as the noise or uncertainty in the change you have just measured. • You want to be confident about measuring the signal (smallest worthwhile change), say 0.5%. • Example: you observe a change of 1%, and the typical error is 2%. • So your uncertainty in the change is 1 ± 2%, or -1% to 3%. • So the change could be harmful through quite beneficial. • So you can’t be confident about the observed beneficial change. • But if you observe a change of 1%, and the typical error is only 0.5%, your uncertainty in the change is 1 ± 0.5%, or 0.5% to 1.5%. • So you can be reasonably confident you have a small but worthwhile change. • Conclusion: ideally, you want typical error < smallest change. • If typical error > smallest change, try to find a better test. • Or repeat the test several times and average the scores to reduce the noise. (Four tests halves the noise.)
Importance of time between trials… • When testing individuals, you need to know the noise of the test determined in a reliability study with a time between trials short enough for the subjects not to have changed substantially. • Exception: to assess change due specifically to, say, a 4-week intervention, you will need to know the 4-week noise. • For estimating sample sizes forresearch, you need to know the noise of the test with the same time between trials as in your intended study. • Beware: noise may be even higher in the study (and therefore sample size will need to be larger) because of individual responses to the intervention. • Individual responses can be estimated from the difference in noise between the intervention and control groups.
More on noise… • As with validity, use logtransformation to get uniformity of error over the range of subjects for some measures. • Check for non-uniformity in a plot of residuals vs predicteds or change scores vs means. • Use the appropriate back-transformation to express the error as a coefficient of variation (percent of subject's mean value). • Ideally, noise < signal, and if signal = 0.20SD, we can work out the reliability correlation: • Intraclass r = (SD2-error2)/SD2 • Validity equation is r2 = (SD2-error2)/SD2. • But want noise < signal; that is, error < 0.20SD. • So ideally r > 0.96! Again, much higher than people realize.
Uses of reliability: estimating sample size for studies with repeated measurement… • In particular, changes in the mean in a crossover and differences in the changes in a parallel-groups controlled trial. • My sample-size spreadsheet is set up for using the typical error, but you can convert a correlation to a typical error via a formula shown in the spreadsheet. • For typical error = smallest important effect, sample size = 10 for a crossover and 24 (12+12) for a parallel-groups trial, using my method of acceptable uncertainty in the outcome. For the traditional approach, sample size is ~3x larger. • For each doubling of the typical error, sample size increases by 4x.
Relationships Between Validity and Reliability • An unreliable measure can't be valid, so short-termreliability sets an upper limit on validity. Examples: • If reliability error = 1%, validity error 1%. • If reliability correlation = 0.90, validity correlation √0.90 (= 0.95). • Reliability of Likert-scale items in questionnaires • Psychologists average similar items in questionnaires to get a factor: a dimension of attitude or behavior. • The items making up a factor can be analyzed like a reliability study. • But psychologists also report alpha reliability (Cronbach's ). • The alpha is the reliability correlation you would expect to see for the mean of the items, if you could somehow sample another set of similar items. • As such, alpha is a measure of consistency of the mean of the items, not the test-retest reliability of the factor. • But √(alpha) is still the upper limit for the validity of the factor.