Download
1 / 40
400 likes | 518 Views
Payment Model Redesign: The Catalyst for System Transformation Don McDaniel Sage Growth Partners. What I’ll Cover. …Current State. …PPACA Basics. …Impact. Current state. The Situation. TECHNOLOGY Interoperability, mHealth, Structured Data, Risk-Adjusted Payments, Analytics. CONSUMERISM

E N D
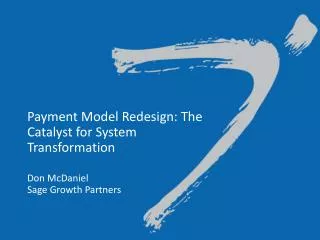
Payment Model Redesign: The Catalyst for System Transformation Don McDaniel Sage Growth Partners
What I’ll Cover …Current State …PPACA Basics …Impact
The Situation TECHNOLOGY Interoperability, mHealth, Structured Data, Risk-Adjusted Payments, Analytics CONSUMERISM Patient Engagement, Transparency, Access, Ubiquity ECONOMICS Margins, Cash Flow, Public Sector Stress, Enrollment Expansion, RAC, Denials DEMOGRAPHICS Chronic Disease, Aging, Population Health, Delivery System Supply REGULATION PPACA, MU, ICD-10, ACO, PCMH,Penalties
Health Expenditures as a Percentage of GDP NHE as a Share of GDP 5.2% 7.2% 9.2% 12.5% 13.8% 14.5% 15.4% 15.9% 16.0% 16.1% 16.2% 16.4% 16.8% 17.9% 17.9% Source: Centers for Medicare and Medicaid Services, Office of the Actuary, National Health Statistics Group, at http://www.cms.hhs.gov/NationalHealthExpendData/ (see Historical; NHE summary including share of GDP, CY 1960-2009; file nhegdp09.zip).
Few Patients Make Up Majority of Costs Source: http://www.oliverwyman.com/media/OW_ENG_HLS_PUBL_Volume_to_Value_Revolution.pdf
The US Health System Is Not Safe Image adapted from Allstate Ad: http://www.allstate.com/content/refresh-attachments/advoc_camp_Jumbo_Jet.pdf
Private Health Insurance Benefits by Spending Category 10% Growth 8% Growth 15% current DRUGS 18% current OUTPATIENT 6.1% Growth OTHER 4% current Slowest Growth 2007-2012 Fastest Growth 2007 - 2012 32% current INPATIENT 8.2% Growth PHYSICIAN 5.4% Growth 32% current Source: Price Waterhouse Coopers Medical Cost Trend: Behind the Numbers 2013 “Other” category includes services such as ambulance, home health and durable medical equipment
Medical Cost Trends – Flat at 6.5% + Utilization Technological • Advancements • Robotics • PET • Increasing High Cost Cases • Aging • Economic Recovery • Employment - Primary Care Innovation Pharma “off patent” Medical Supplies/Equipment Price Transparency • Comparative Cost Information • State-mandated Reporting – 30 states • Consolidation • Physician employment • Purchaser Pressure • Workplace and retail clinics • Telemedicine • Mobile Health • PCMH • Many blockbusters “off patent” driving savings Source: Price Waterhouse Coopers Medical Cost Trend: Behind the Numbers 2014
Challenged Public Payers Source: Avalere Health analysis of American Hospital Association Annual Survey data, 2010, for community hospitals. (1) Includes Medicaid Disproportionate Share payments.
Rise in Insurance Premiums Source: Kaiser/HRET Survey of Employer-Sponsored Health Benefits, 2012.
Rise in High Deductible Plans Deductibles over $1,000 for Single Coverage • * Estimate is statistically different from estimate for the previous year shown (p<.05). • Note: These estimates include workers enrolled in HDHP/SO and other plan types. Because we do not collect information on the attributes of conventional plans, to be conservative, we assumed that workers in conventional plans do not have a deductible of $1,000 or more. Because of the low enrollment in conventional plans, the impact of this assumption is minimal. Average general annual health plan deductibles for PPOs, POS plans, and HDHP/SOs are for in-network services. • Source: Kaiser/HRET Survey of Employer-Sponsored Health Benefits, 2006-2012.
Physician Employment Trends Source: Accenture Physician Alignment Survey 2012. http://www.accenture.com/SiteCollectionDocuments/PDF/Accenture-Clinical-Transformation-New-Business-Models-for-a-New-Era-in-Healthcare.pdf
Volume to Value: Reasons for the Shift Driver: Public Reimbursement as % of Commercial Risk Shift Payer Value Based Portfolio *Including SGR rate cuts CMS Office of the Actuary May 2012 Porter Research Study 2013 ACO Growth Medicaid MCOs 2013 687 Leavitt Partners 2013
PPACA Timeline Source: http://www.bankrate.com/finance/insurance/timeline-for-health-care-reform-1.aspx
State Decisions on Medicaid Expansion Source: Advisory Board http://www.advisory.com/Daily-Briefing/2012/11/09/MedicaidMap#lightbox/1/
State Decisions for Creating State Insurance Exchanges Source: Deliotte. Health Insurance Exchanges: Individual Market Competition. http://www.deloitte.com/assets/Dcom-UnitedStates/Local%20Assets/Documents/Health%20Plans/us_hp_hix_IndividualMarketCompetition_81313.pdf Source: Kaiser Health News
Race The majority are white. Health status The majority are in relatively good health. Marital status Most are notmarried. Language One in five speak a language other than English at home. Educational attainment Three-fourths do not hold a college degree. Employment status More than half are employed full-time. White Excellent/ Very good/ Good Married Non-English No college degree Employed full-time 2021 - What Will Exchange Patients Look Like? 2021 Exchange Patient Profile 92% 78% 76% 56% 38% 19% Median Age Median income 33 238% FPL Individual exchange members Sources: PwC HRI analysis for year 2021, Current Population Survey, Medical Expenditure Panel Survey and CBO
Minimum Essential Coverage aka Individual Mandate • Coverage is required in 2014 unless you have an exemption • Federal premium subsidy up to 400% of the FPL • $45,960 for an individual • $94,200 for a family of four • States without Medicaid expansion have the big GAP • Subsidy eligible – may chose to have the exchange send the money directly to the insurer every month OR may receive a tax credit when they file taxes the following year • Penalty for no coverage in 2014 = $95 or 1% of your income in 2014 whichever is greater unless you quality for an exception
Hypothesis: Health Care Will be Disrupted There is an overwhelming confluence of interests, incentives, and macro-environmental forces that will disrupt the industry and drive real change – Payment model redesign will be a core catalyst for change
Evolving Payment Models • Pay-for-outcomes models – Value-Based payments • Bundled payment arrangements • Quality performance incentives • Gain sharing • Narrow network arrangements • Shared-risk/Full-risk payments • Business model typology • Fee-for-service • Fee-for-outcome • Fee-for-access/Network model
Why VBP? • Purchasers are demanding more accountability around quality and cost • Medicare and Medicaid need the “stop loss” • Its a way to take and grow share • It allows a focus on “industrial improvement” • Its working in key markets • Its driving quality outcomes
ACO Reach by the Numbers Source: http://www.oliverwyman.com/media/OW_ENG_HLS_PUBL_The_ACO_Surprise.pdf
High Performing Delivery Models Vermont Medicaid PCMH $76 M Reduction in ED visits Reduction in inpatient services Lower PMPM costs (2008-2010) Total Shared Savings of 13 ACOs Net Savings for Medicare Trust Funds Amount 2 ACOs owe Medicare for losses $33 M $4 M 22% 31% 21% Pioneer ACOs Sources: http://www.pcpcc.org/content/results-evidencehttp://beckershospitalreview.com/accountable-care-organizations/all-pioneer-acos-improve-quality-just-13-achieve-shared-savings.html
Authors called top-ranked orthopedic hospitals in the US and 2 largest hospitals in each state • Fee for hospital + fee for surgeon • Of the 20 top-ranked hospitals, 55% could not provide a single “bundled price” for the procedure • 40% could not provide an estimate • 90% could not provide a single “bundled price” • 37% could not provide an estimate • Variation was shockingly vast, ranging from a low of $11,100 to a high of $125,798.70 Source: Journal of the American Medical Association Internal Medicine http://archinte.jamanetwork.com/data/Journals/INTEMED/0/jamainternmed.2013.465.pdf
Reaction to Price Transparency • CalPERS decided to cap payments for knee and hip replacement surgeries at $30,000 for its Anthem Blue Cross members because the pension fund was paying anywhere between $15,000 and $110,000 for such procedures. • The average price for the knee and hip replacements at higher-priced hospitals in the state decreased by 37%. • In addition, the use of preferred hospitals among CalPERS members increased by 21% between 2010 and 2012.
Takeaways for Employers • In old-economy health care there was no premium paid for choreography and “systems thinking”- that’s changing • Employees can only get subsidies if employer does not offer coverage • Premiums may go up
Questions? Thank you Don McDaniel dmcdaniel@sage-growth.com 410.534.1161 443.904.2882