Download
1 / 28
280 likes | 307 Views
Upper Air Data The Atmosphere is 3D and can not be understood or forecast by using surface data alone. Modern Radiosondes-a key upper air data source. Radiosonde. Generally twice a day at 00 and 12 UTC. Radiosonde believe it or not….

E N D
Upper Air DataThe Atmosphere is 3D and can not be understood or forecast by using surface data alone
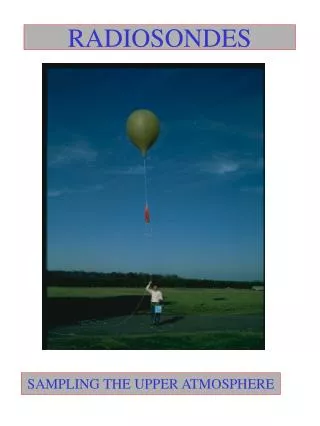
Radiosonde believe it or not… A typical NWS "weather balloon" sounding can last in excess of two hours. In that time, the radiosonde can ascend to an altitude exceeding 35 km (about 115,000 feet) and drift more than 300 km (about 180 miles) from the release point. Typical pressure at balloon burst about 5 hPa (1/200th of surface pressure).
Radiosonde Video http://www.youtube.com/watch?v=jGQWUFEMxT8 Cam on radiosonde https://www.youtube.com/watch?v=pCve1w1GFOs Full flight: https://www.youtube.com/watch?v=xkFsy-u3dDo https://www.youtube.com/watch?v=9CjjbauSvBE
ACARS: Aircraft Observations Aircraft Communications Addressing and ReportingSystem
Satellite Data Geostationary and Polar Orbiting Satellites
Cloud and Water Vapor Track Winds Based on Geostationary Weather Satellites
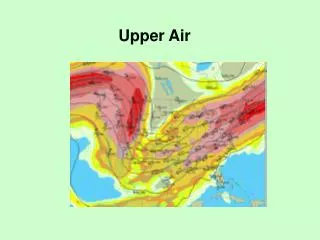
With all this upper atmospheric data with can describe the 3D AtmosphereOne way to present this information is with upper level charts
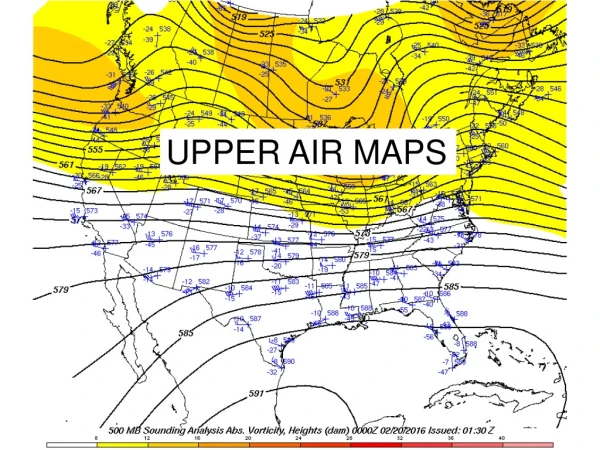
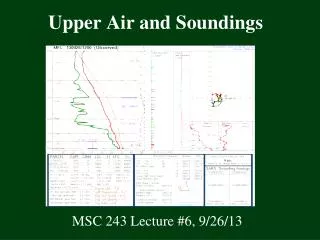
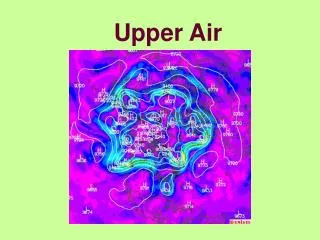
Upper Level Chart
Upper Level Maps • Meteorologists use upper level charts that describe atmospheric structure aloft. • They have one major difference with surface charts • Surface charts give pressure at a constant height • Upper air charts give the height of a pressure surface above sea level.
Upper Level Charts Give the Heights of Constant Pressure LevelsEssentially how the pressure level undulates in 3D space • Typical levels include: • 850 hPa ~5000 ft, 1.5 km ASL • 700 hPa ~10,000 ft, 3 km ASL • 500 hPa ~18,000 ft, 5.5 km ASL • 250 hPa ~34,000 ft, 10.5 km ASL
Upper level charts have a station model • Heights in meters (solid lines) • Temperatures in Celcius/Centigrade (C)-dashed lines. • Upper air station model (a bit different than surface one)
Upper Level Charts • Winds tend to follow the height lines • The greater the gradient in height lines, the stronger the winds • Drying conditions are often found under and to the east of ridges. • Moist, cloudy conditions under and to the east of troughs.


![Introduction to upper air measurements with radiosondes and other in situ observing systems [2]](https://cdn2.slideserve.com/4906843/slide1-dt.jpg)
![Introduction to upper air measurements with radiosondes and other in situ observing systems [3]](https://cdn2.slideserve.com/5014444/slide1-dt.jpg)