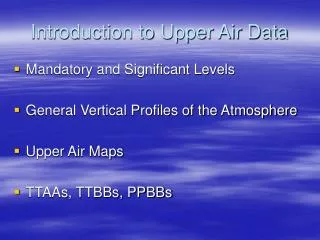
UPPER AIR DYNAMICS (continued)
This lecture covers the intricate details of upper air dynamics, focusing on 500 mb and 250 mb charts. We analyze the relationships between ridges and troughs, the vertical structure of fronts, and surface pressure systems in meteorology. Key concepts addressed include the impact of temperature on pressure levels, the significance of vorticity, and the conditions necessary for surface low development. By examining wind patterns, convergence, and divergence, we can forecast precipitation types and understand atmospheric behavior.

UPPER AIR DYNAMICS (continued)
E N D
Presentation Transcript
UPPER AIR DYNAMICS (continued) MSC 243 Lecture #8, 10/22/09
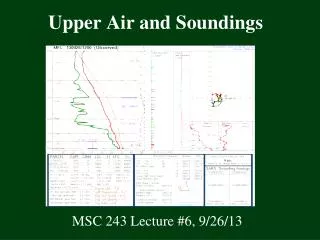
Increasing Height Ridge Ridge 500 mb 500 mb Trough Trough 700 mb 850 mb Surface Very warm column Cool column Warm column Very cool column Ridges and Troughs Aloft • Mountains and valleys of warm and cool air • The height of the pressure level depends on the temperature of the column of air below it
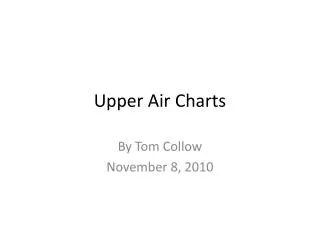
Recap of FCST 4 1. Loop “250 Spd”, then stop it at the initial time and describe the general pattern (troughs/ridges) over and just offshore of the USA. What is the highest wind speed on the map, and where is it? 2. Does the 500 mb pattern look similar to the 250 mb pattern at the initial time? Now wind the two loops forward to 18Z Friday. Carefully identify the relative locations of the trough axes at each level around the Great Plains. Which one is further upstream?
RIDGE RIDGE TROUGH TROUGH
3. Where is the surface low located relative to the 500 mb low (and is it upstream or downstream)? If the 250 mb trough/low is upstream of the 500 mb trough/low, and the 500 mb trough is upstream of the surface low/trough, then conditions are favorable for the surface low to develop. Is this the case here? 4. Now wind forward the surface loop through to 06Z Sunday. Note down the minimum sea level pressure every 6 hours. Did this development support your argument in Question 3?
5. Note down the location of maximum vorticity (red) associated with our weather system at 12Z Saturday. 6. Where is the vorticity maximum located with respect to the 500 mb trough axis at this time? Also, where is the vorticity maximum located with respect to the surface low (upstream / same position / downstream?) 7. What direction are the 500 mb winds travelling in, over the surface low? Are the winds bringing in low vorticity or high vorticity aloft over the surface low, i.e. is there advection of negative or positive vorticity (or none)?
8. Now go to “850 Theta-e” and identify the locations of the cold front. How does the location of the front differ from that at the surface (2m Theta-e)? (This question is just to get an idea of the vertical structure of a front that we learned in class) 850 mb level?
What to diagnose at different pressure levels 850 mb: useful for estimating surface temperatures, low level moisture, and determining precipitation type (rain, snow, sleet).
700 mb chart The 700 mb chart is used to determine cloud cover or rainfall, using the relative humidity field and the vertical motion field.
700 mb chart The 700 mb chart is also used to determine short-wave disturbances via the geopotential height field.
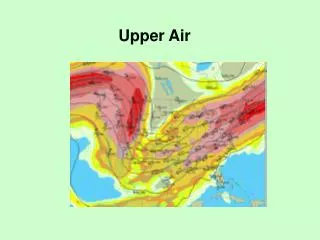
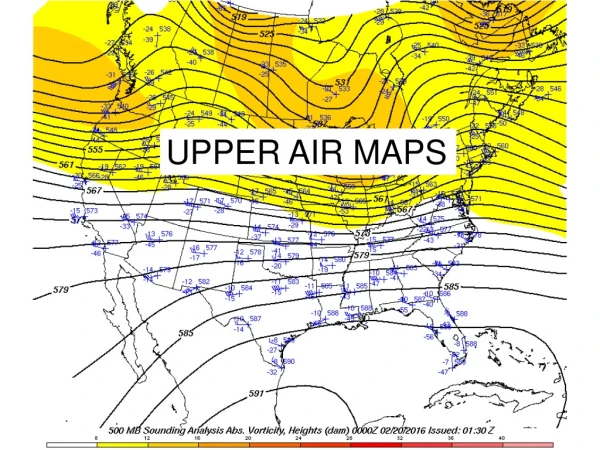
500 mb geopotential height The 500 mb chart is the forecasters’ favorite for depicting the motion of weather systems. It shows the large-scale flow (long waves) and jet streams, and also the small-scale flow (short-waves, low level storm systems) RIDGE TROUGH
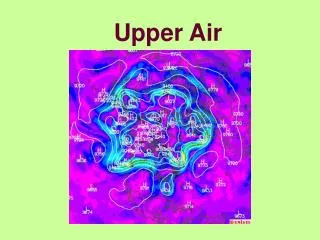
250 mb Chart The 250 mb chart is used to locate the jet stream. Strong upper- level winds help develop surface low pressure in mid-latitudes.
Thickness (yellow lines): what is it related to? 5400m contour = first approx for rain/snow border
Convergence and Divergence • (Horizontal) Convergence: more air is entering an area than leaving it on a pressure surface • (Horizontal) Divergence: more air is leaving an area than entering it on a pressure surface • Because mass is conserved, horizontal divergence relates directly to vertical motion
What can we tell from a 500 mb chart? Convergence upstream of trough axis. Winds coming together, height contours narrowing. Speed increases following the flow. Divergence downstream of trough axis. Winds spreading apart, height contours widening. Speed decreases following the flow. “Upstream of trough axis “Downstream of trough axis TROUGH
Divergence aloft is associated with rising motion and surface low pressure • Convergence aloft is associated with sinking motion and surface high pressure • Surface pressure patterns are offset from troughs and ridges aloft in developing systems 500 mb Ridge Convergence Divergence Convergence Trough Rising Sinking Sinking Surface High Pressure Low Pressure High Pressure
Development of Surface Low • Net convergence west (upstream) of an upper air trough and net divergence east (downstream) of an upper air trough. • For a surface storm to intensify, the upper air trough must be located upstream of the surface low. Divergence aloft, convergence below = “good upper-level support” • As the upper air low moves closer to being directly over the surface low, upper air divergence lessens and the surface low stops deepening (intensifying). • The surface weather often improves once the 500 mb trough axis has passed.
Vorticity Divergence is tricky! It is difficult to accurately measure divergence, and nearly impossible to use the observed horizontal winds to diagnose vertical motion. Can it be related to something else – yes it can! Vorticity is a measure of the rotation of a fluid around a local vertical axis. • Earth's vorticity • The local vertical component of spin due to the rotation of the earth • Depends on latitude (greatest at poles, zero at equator) • Earth's vorticity = 2 x rate of rotation x sin(latitude) • Relative vorticity • Vorticity generated by air motions relative to the earth • Counter-clockwise flow is positive vorticity (spin) • Clockwise flow is negative vorticity (spin)
Total (Absolute) Vorticity • Absolute vorticity = Earth's vorticity + Relative vorticity • Absolute vorticity is always positive (at the large scale) in middle and high latitudes • Meteorologists focus on vorticity at the 500 mb level to diagnose (and predict) vertical motion and the converging and diverging areas above and below 500 mb • Absolute vorticity on the large scale changes relatively slowly with time, and so discrete structures can be reliably tracked, from observations and in models
Finding divergence from vorticity maps Simple relation to qualitatively diagnose divergence from vorticity maps. Divergence is associated with Vorticity Advection Positive vorticity advection (PVA) east of the 500 mbtrof often corresponds to POSITIVE DIVERGENCE aloft Negative vorticity advection (NVA) west of the 500 mbtrof often corresponds to NEGATIVE DIVERGENCE, i.e. CONVERGENCE
Vorticity and Vertical Motion Downstream of Negative Vorticity = Sinking Motion Downstream of Positive Vorticity = Rising Motion 5280 m N 5580 m 5700 m 5400 m 08 Negative Vorticity 5520 m 06 16 5820 m 20 5640 m X 02 12 N Positive Vorticity X H 5760 m 500-mb heights and vorticity for January 7, 2002 (00Z Jan 8). Heights are in meters (solid) and vorticity is in 1x10⁻⁵ s-1 (dashed). The “N” denotes a local vorticity minimum and the “X” denotes a local vorticity maximum. 500-mb heights and vorticity for January 22, 2002 (00Z Jan 23). Heights are in meters (solid) and vorticity is in 1x10⁻⁵ s-1 (dashed). The “N” denotes a local vorticity minimum and the “X” denotes a local vorticity maximum.