Download
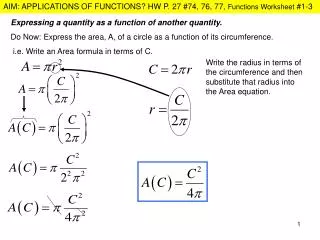
1 / 7
70 likes | 143 Views
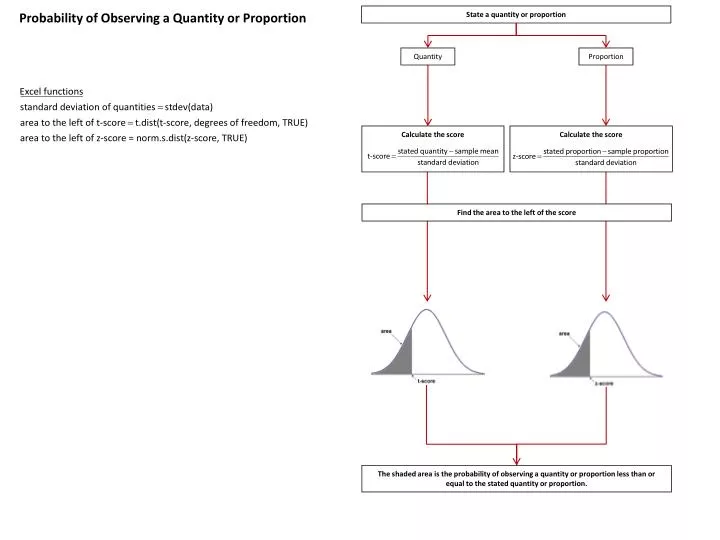
Probability of Observing a Quantity or Proportion. State a quantity or proportion. Quantity. Proportion. Calculate the score. Calculate the score. Find the area to the left of the score.

E N D
Probability of Observing a Quantity or Proportion State a quantity or proportion Quantity Proportion Calculate the score Calculate the score Find the area to the left of the score The shaded area is the probability of observing a quantity or proportion less than or equal to the stated quantity or proportion.
Hypothesis Test for a Single Proportion State the hypothesis HA proportion > k HA proportion < k HA ≠ Calculate the score Find the p-value (standard normal distribution) p-value = 1 – norm.s.dist(z-score, TRUE) p-value = 2 x (1 – norm.s.dist(abs(z-score), TRUE)) p-value = norm.s.dist(z-score, TRUE) State the conclusion p-value approach: The probability of the null hypothesis being true is the p-value. Significance approach: If p-value < significance level, reject the null hypothesis.
Hypothesis Test for Comparing Proportions State the hypothesis HA > HA < HA ≠ Calculate the score Find the p-value (standard normal distribution) p-value = 1 – norm.s.dist(z-score, TRUE) p-value = 2 x (1 – norm.s.dist(abs(z-score), TRUE)) p-value = norm.s.dist(z-score, TRUE) State the conclusion p-value approach: The probability of the null hypothesis being true is the p-value. Significance approach: If p-value < significance level, reject the null hypothesis.
Hypothesis Test for a Single Mean State the hypothesis HA mean > k HA mean < k HA ≠ Calculate the score Find the p-value (t distribution) p-value = 1 – t.dist(t-score, df, TRUE) p-value = 2 x (1 – t.dist(abs(t-score), df, TRUE)) t p-value = t.dist(t-score, df, TRUE) State the conclusion p-value approach: The probability of the null hypothesis being true is the p-value. Significance approach: If p-value < significance level, reject the null hypothesis.
Hypothesis Test for Comparing Means State the hypothesis HA > HA < HA ≠ Calculate the score Find the p-value (t distribution) p-value = 1 – t.dist(t-score, df, TRUE) p-value = 2 x (1 – t.dist(abs(t-score), df, TRUE)) t p-value = t.dist(t-score, df, TRUE) State the conclusion p-value approach: The probability of the null hypothesis being true is the p-value. Significance approach: If p-value < significance level, reject the null hypothesis.
Hypothesis Test for a Single Variance State the hypothesis HA variance > k HA variance < k HA ≠ Calculate the score Find the p-value (Chi-squared distribution) p-value = 2 x (1 – chi.dist(x-score, df, TRUE)) or 2 x chi.dist(x-score, df, TRUE), whichever is less p-value = 1 – chi.dist(x-score, df, TRUE) p-value = chi.dist(x-score, df, TRUE) State the conclusion p-value approach: The probability of the null hypothesis being true is the p-value. Significance approach: If p-value < significance level, reject the null hypothesis.
Hypothesis Test for Comparing Variances State the hypothesis HA larger > smaller HA larger < smaller HA ≠ Calculate the score Find the p-value (F distribution) p-value = 2 x (1 – f.dist(f-score, df, df, TRUE)) p-value = 1 – f.dist(f-score, df, df, TRUE) p-value = f.dist(f-score, df, df, TRUE) State the conclusion p-value approach: The probability of the null hypothesis being true is the p-value. Significance approach: If p-value < significance level, reject the null hypothesis.