Download
1 / 69
690 likes | 1.15k Views
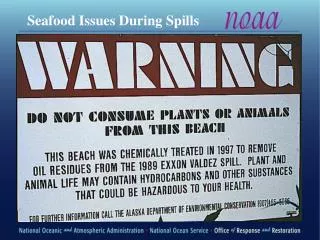
Seafood Issues During Spills Painting by Raul Colon for Time Magazine Seafood Contamination: Threat to Public Health Photo: Tilapia.com Photo: Newfoundland & Labrador Dept. of Trade & Technology Seafood & Fisheries Issues during Oil Spills: What We’re Gonna Talk About

E N D
Photo: Tilapia.com Photo: Newfoundland & Labrador Dept. of Trade & Technology
Seafood & Fisheries Issues during Oil Spills:What We’re Gonna Talk About • Introduction & background • What’s at risk • Fisheries impacts in international spills • A little science related to tainting • Sensory assessment • A couple of U.S. spill examples • Reference materials • Overview of regional experiences
Seafood &Fisheries Issues During Spills:So, What’s the Big Deal? Oil spills can threaten: • Public health • Fisheries & associated economies • The resources themselves • Regional social and ethnocultural fabric
Seafood &Fisheries Issues During Spills:So, What’s the Big Deal? Oil spills can threaten: • Public health • Fisheries & associated economies • The resources themselves • Regional social and ethnocultural fabric
Food safety in the American consciousness… Photo: W. Eugene Smith, 1972 Photo: Food Safety Network
Seafood &Fisheries Issues During Spills:So, What’s the Big Deal? Oil spills can threaten: • Public health • Fisheries & associated economies • The resources themselves • Regional social and ethnocultural fabric
Potential Economic Effects of an Oil Spill on the Seafood Industry(Knapp, 2005)
Oil Spill Economics:“Perceived Quality Demand Effect (PQDE)” • Significance of the PQDE depends on the extent to which buyers perceive that fish may have been tainted: • Publicity may raise concerns of buyers or consumers even if no tainted fish are offered for sale • Even a small amount of uncertainty may affect demand for fish from a region where a spill has occurred—especially if buyers have alternative sources of supply. • PQDE can be reduced or eliminated by: • Ensuring that tainted fish are not offered for sale • Ensuring that buyers know that tainted fish are not being offered for sale Source: G. Knapp, University of Alaska-Anchorage
Seafood &Fisheries Issues During Spills:So, What’s the Big Deal? Oil spills can threaten: • Public health • Fisheries & associated economies • The resources themselves • Regional social and ethnocultural fabric
Photo: City of Oklahoma City North Cape photos: Frank Csulak, NOAA
North Cape Spill, 1996Calculated Resource Mortalities • Marine environment • 9 million lobsters • 19 million surf clams • 4.2 million fish • >500,000 kg worms, crabs, mussels, sea stars • Salt ponds: • 7 million worms & amphipods • > 1 million crabs, shrimp, clams oysters • 500,000 fish
Salmon photos: Jeep Rice, NOAA Oil Impacts to Larval Herring & Salmon Herring photos: Mark Carls, NOAA
Seafood &Fisheries Issues During Spills:So, What’s the Big Deal? Oil spills can threaten: • Public health • Fisheries & associated economies • The resources themselves • Regional social and ethnocultural fabric
Photo: C.A. Woody, USGS Photo: Alaska Museum of History & Art
Seafood Contamination During Spills:Tainting Tainting = abnormal odor or flavor • Introduced into seafood from external sources • Excludes natural byproducts of decomposition from storage & microbial contamination; taint is derived from materials present in the surroundings • American Society for Testing & Materials (ASTM) and International Standards Organisation (ISO) standards exist for tainting and assessment of tainting
Petroleum Tainting:A Few Measurements in the Lab(Davis et al., 2002) • Tainting thresholds (Forties crude oil): • Trout 0.10 mg/L • Salmon 0.11 mg/L • Crab >7.7 mg/L • Mussels 0.03 mg/L • Tainting occurs rapidly in fish • Detected in fish within 30 min. of exposure to 20 & 31 mg/L crude oil in water • Loss of taint can be slow: weeks to months • In tainted salmon, naphthalenes were the most prevalent PAHs
Correlating Taint & Chemistry: T/V Braer & Pen-Reared Salmon 50 100 40 80 30 60 Percent distribution of naphthalenes Percent taint positives 40 20 10 20 0 0 0 50 100 150 200 Days since grounding Source: Whittle et al. (1997)
Exxon Valdez—1989 Photo: © M. Rosenberg
Guidance on Sensory Testing & Monitoring of Seafood During Oil Spills • Authored by Terri Reilly (NOAA/NMFS Seafood Inspection Program) & Roberta York (Canadian Food Inspection Agency) • Systematic “how to” document for conducting sensory testing
Guidance on Sensory Testing & Monitoring of Seafood During Oil Spills • Scope & Use • Sample collection & preservation • Selecting test methods • Selecting, training & validating assessors • Facilities requirements • Sample handling, prep & presentation • Sensory evaluation protocols • Data analysis & decision criteria
Oil Chemistry as a Tool for Assessing Seafood Risk • Advantages • Quantitative • Confirms that oil is source of taint • Very low detection limits • Disadvantages • Expensive • Requires long lead time • Must feed into risk assessment…”So what?” question
Oil (PAHs) & Human Risk Assessment:Toxicity Equivalency Approach • Designed by USFDA, used during Exxon Valdez, based on carcinogenic endpoint • Additional cancer risk considered to be “acceptable” by risk managers • Risk is calculated from body weight, consumption rate, cancer potency of contaminant, exposure duration • Oiled seafood risk is based on benzo(a)pyrene (BaP) because BaP is known carcinogen and empirical data exist • Toxicity of other PAHs is based on BaP toxicity—”BaP equivalents”
Oil (PAHs) & Human Risk Assessment:BaP Equivalency Caveats • Based on cancer risk • Based on animal studies • If insufficient toxicity data for a given PAH exists to calculate a BaP potency, that PAH is omitted • Few of the PAHs we measure are included in the BaP calculation • Most PAH cancer potencies are for pyrogenic (combustion-sourced) vs. petrogenic (oil-sourced) hydrocarbons • Different equivalency values have been used at different spills—no standardization