Download
1 / 72
720 likes | 1.09k Views
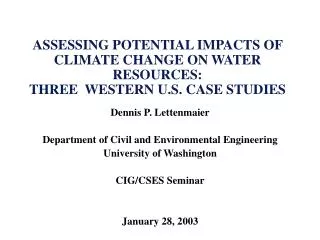
Dennis P. Lettenmaier Department of Civil and Environmental Engineering University of Washington CIG/CSES Seminar January 28, 2003. ASSESSING POTENTIAL IMPACTS OF CLIMATE CHANGE ON WATER RESOURCES: THREE WESTERN U.S. CASE STUDIES. Climate variability and change context

E N D
Dennis P. Lettenmaier Department of Civil and Environmental Engineering University of Washington CIG/CSES Seminar January 28, 2003 ASSESSING POTENTIAL IMPACTS OF CLIMATE CHANGE ON WATER RESOURCES: THREE WESTERN U.S. CASE STUDIES
Climate variability and change context Prediction and assessment approach Accelerated Climate Prediction Initiative (ACPI) Hydrology and water management implications for Columbia, Sacramento-San Joaquin, and Colorado River basins Conclusions and comparative analysis Outline of this talk
Natural Climate Influence Human Climate Influence All Climate Influences
Almost every station shows warming (filled circles) Urbanization not a major source of warming Temperature trends in the PNW over the instrumental record
Trends in timing of spring snowmelt (1948-2000) +20d later –20d earlier Courtesy of Mike Dettinger, Iris Stewart, Dan Cayan
Climate Scenarios Performance Measures Downscaling Global climate simulations, next ~100 yrs Delta Precip, Temp Reliability of System Objectives Reservoir Model Hydrologic Model (VIC) DamReleases, Regulated Streamflow Natural Streamflow
Coupled Land-Atmosphere-Ocean General Circulation Model Reservoir Model Hydrology Model
Accelerated Climate Prediction Initiative (ACPI) – NCAR/DOE Parallel Climate Model (PCM) grid over western U.S.
Bias Correction and Downscaling Approach • climate model scenario • meteorological outputs hydrologic model inputs • snowpack runoff streamflow • 2.8 (T42)/0.5 degree resolution • monthly total P, avg. T • 1/8-1/4 degree resolution • daily P, Tmin, Tmax
bias-corrected climate scenario from NCDC observations month m month m raw climate scenario from PCM historical run Bias Correction Note: future scenario temperature trend (relative to control run) removed before, and replaced after, bias-correction step.
monthly PCM anomaly (T42) interpolated to VIC scale VIC-scale monthly simulation observed mean fields (1/8-1/4 degree) Downscaling
Overview of ColSim Reservoir Model Reservoir Operating Policies Reservoir Storage Regulated Streamflow Flood Control Energy Production Irrigation Consumption Streamflow Augmentation Physical System of Dams and Reservoirs Streamflow Time Series
Dam Operations in ColSim Storage Dams Virgin Regulated Run-of-River Dams Flow In=Flow out + Energy H
Storage Reservoirs • Releases Depend on: • Storage and Inflow • Rule Curves (streamflow forecasts) • Flood Control Requirements • Energy Requirements • Minimum Flow Requirements • System Flow Requirements Inflow ColSim Consumptive use Inflow Inflow Consumptive use Inflow Inflow Inflow + Inflow Run of River Reservoirs (inflow=outflow + energy) System Checkpoint
GCM grid mesh over western U.S. (NCAR/DOE Parallel Climate Model at ~ 2.8 degrees lat-long)
Climate Change Scenarios PCM Simulations (~ 3 degrees lat-long) Historical B06.22 (greenhouse CO2+aerosols forcing) 1870-2000 Climate Control B06.45 (CO2+aerosols at 1995 levels) 1995-2048 Climate Change B06.44 (BAU6, future scenario forcing) 1995-2099 Climate Change B06.46 (BAU6, future scenario forcing) 1995-2099 Climate Change B06.47 (BAU6, future scenario forcing) 1995-2099 PNNL Regional Climate Model (RCM) Simulations (~ ¾ degree lat-long) Climate Control B06.45 derived-subset 1995-2015 Climate Change B06.44 derived-subset 2040-2060
3 ensembles averaged summarized into 3 periods; Period 1 2010 - 2039 Period 2 2040 - 2070 Period 3 2070 - 2098 Future streamflows
Regional Climate Model (RCM) grid and hydrologic model domains
ACPI: PCM-climate change scenarios, historic simulation v air temperature observations
ACPI: PCM-climate change scenarios, historic simulation v precipitation observations
4a) Hydrology and water management implications: Columbia River Basin
BAU 3-run average historical (1950-99) control (2000-2048) PCM Business-as-Usual scenarios Columbia River Basin (Basin Averages)
RCM Business-as-Usual scenarios Columbia River Basin (Basin Averages) PCM BAU B06.44 RCM BAU B06.44 control (2000-2048) historical (1950-99)
PCM Business-As-Usual Mean Monthly Hydrographs Columbia River Basin @ The Dalles, OR 1 month 12 1 month 12
55,000,000 50,000,000 45,000,000 40,000,000 End of Month Total System Storage (acre-feet) 35,000,000 30,000,000 Max Storage Control 25,000,000 Base Climate Change Change (Alt. 2) Dead Pool 20,000,000 15,000,000 O N D J F M A M J J A S CRB Operation Alternative 2 (reduce flood storage by 20%)
4a) Hydrology and water management implications: Sacramento-San Joaquin River Basin
PCM Business-as-Usual scenarios California (Basin Average) BAU 3-run average historical (1950-99) control (2000-2048)
PCM Business-as-Usual Scenarios Snowpack Changes California April 1 SWE
1 month 12 1 month 12 PCM Business-As-Usual Mean Monthly Hydrographs Shasta Reservoir Inflows
Folsom Lake Storage: 977 taf Lake Shasta Storage: 4552 taf Lake Oroville Storage: 3538 taf Trinity Lake Storage: 2448 taf Whiskeytown Storage: 241 taf Trinity Shasta Whiskeytown Oroville (SWP) Dam Power Plant River Transfer Sacramento River Basin Trinity River Clear Creek Feather River Sacramento River American River Folsom Delta
Delta Sacramento-San Joaquin Delta Area: 1200 mi2 San Luis Reservoir CVP: 971 taf SWP: 1070 taf Millerton Lake Storage: 761 taf New Melones Res Storage: 2420 taf Don Pedro/McClure Storage: 3055 taf Pardee/Camanche Reservoir Storage: 615 taf Eastman, Hensley, & Millerton Delta & San Joaquin R Basin Mokelumne River Pardee & Camanche Delta Outflow Delta Calaveras River New Hogan Stanislaus River San Luis San Joaquin River New Melones Dam Power Plant River/Canal Transfer Tuolumne & Merced Rivers New Don Pedro & McClure
Current Climate vs. Projected Climate • Storage Decreases • Sacramento • Range: 5 - 10 % • Mean: 8 % • San Joaquin • Range: 7 - 14 % • Mean: 11 %
Current Climate vs. Projected Climate • Hydropower Losses • Central Valley • Range: 3 - 18 % • Mean: 9 % • Sacramento System • Range: 3 – 19 % • Mean: 9% • San Joaquin System • Range: 16 – 63 % • Mean: 28%