Chi-Square Test ( χ 2 )
Chi-Square Test ( χ 2 ). χ – greek symbol “chi”. When is the Chi-Square Test used?. The chi-square test is used to determine whether there is a significant difference between the expected frequencies and the observed frequencies in one or more categories.

Chi-Square Test ( χ 2 )
E N D
Presentation Transcript
Chi-Square Test (χ2) χ – greek symbol “chi”
When is the Chi-Square Test used? The chi-square test is used to determine whether there is a significant difference between the expected frequencies and the observed frequencies in one or more categories. Also, the chi-square test is used to test for independence of two or more different categories. If there is a significant difference, it basically implies that χ2 > σ, where σ is the stated significance level with usual values of 1%, 5% or 10%. Take note that the significance level (σ) is always given in a problem. Chi-Square Test (χ2)
Chi-Square Test Requirements 1. Quantitative data. 2. One or more categories. 3. Independent observations. 4. Adequate sample size (at least 10). 5. Simple random sample. 6. Data in frequency form. 7. All observations must be used. Chi-Square Test (χ2)
How to find the value of χ2? Consider this problem: • Carl, the manager of a car dealership, did not want to stock cars that were bought less frequently because of their unpopular color. The five colors that he ordered were red, yellow, green, blue, and white. According to Carl, the expected frequencies or number of customers choosing each color should follow the percentages of last year. • She felt 20% would choose yellow, 30% would choose red, 10% would choose green, 10% would choose blue, and 30% would choose white. She now took a random sample of 150 customers and asked them their color preferences. Is there a significant difference between the observed and expected frequencies? σ = 5% Chi-Square Test (χ2)
Color Preferences for 150 Customers: Chi-Square Test (χ2)
We are testing if Carl’s expected frequencies “fit” with the observed frequencies. That is why a chi square test is sometimes called the goodness of fit or how good some expected frequency fits into observed data. Chi-Square Test (χ2)
We must first state our hypotheses, (Ho and Ha) Null hypothesis • There is no significant difference between the expected and observed frequencies. • Alternative hypothesis • There is a significant difference between the expected and observed frequencies. • In other words, if the probability of getting the observed frequency is within our area of rejection (bounded by our chi critical value), we are going to reject our null hypothesis. Otherwise, we are going to approve. Chi-Square Test (χ2)
Formula for Calculating χ2 Chi-Square Test (χ2) where O is the observed frequency; E is the expected frequency; We already know the observed frequencies which were listed in the previous slide. We need to find out the expected frequencies.
How to get Expected Frequency (E) We get the total number of customers and multiply it to its corresponding percentage. For Yellow: 150 x 0.2 = 30 For Red: 150 x 0.3 = 45 … and so on. Values are tabulated in the next slide. Chi-Square Test (χ2)
Getting χ2 To get χ2, we take the summation of the squares of the differences between observed frequencies and expected frequencies all over each corresponding expected frequency. Therefore, for our first data set, 35-30 = 5 5^2 = 25 25 / 30 (E) = 5/6 Second data set, 50-45=5 5^2 = 25 25 / 45 (E) = 5/9 Following with the remaining three sets, we add all of those values. That is our chi squared statistic. Chi-Square Test (χ2)
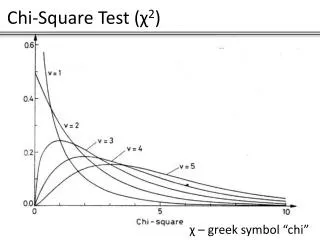
Calculating our Chi Critical Value (χc2) To get χc2, we get our Chi table and locate our critical value with degrees of freedom (Df) and significance level (σ). Df = 5 – 1 = 4 σ = 0.05 Chi-Square Test (χ2)
Df = 4 σ = 0.05 Chi-Square Test (χ2) χc2 = 9.49 χ2 = 26.95
Conclusion: χ2is a lot bigger from our Chi critical value χc2. In the Chi distribution graph, the area bounded by our Chi critical value (area of rejection) definitely overlaps with the area bounded by our Chi statistic. We are therefore inclined to reject our null hypothesis at 5% significance level and Carl’s distribution is incorrect. (does not fit) Chi-Square Test (χ2)
TEST FOR INDEPENDENCE Problem: In a certain town, there are about one million eligible voters. A simple random sample of 10000 eligible voters was chosen to study the relationship between sex and participation in the last election. The contingency table is shown in the 2nd slide after this slide :P. We want to find out if gender and voting are independent. σ = 0.05 Chi-Square Test (χ2)
Null and Alternate Hypotheses Ho = Sex is independent from voting. Ha = Sex and voting are dependent. Chi-Square Test (χ2)
OBSERVED FREQUENCIES Chi-Square Test (χ2) Contingency Table
Formula for Expected Frequency In order to get the expected frequency, it is defined by the formula: Expected frequency = RowTotal x ColumnTotal / GRAND TOTAL Chi-Square Test (χ2)
EXPECTED FREQUENCIES Chi-Square Test (χ2)
Summary of Frequencies Chi-Square Test (χ2)
Computing Df(degrees of freedom) Degrees of freedom for chi square test of independence is equal to: (rows-1)*(columns-1) = Df (2-1) = 1 * (2-1) = 1 * 1 = Df Df = 1 We then get our chi critical value by getting Chi table and locating significance level 0.05 and Dfof 1. Chi-Square Test (χ2)
Chi-Square Test (χ2) χc2 = 3.84 χ2 = 6.53
Conclusion: Since our χc2 > χ2, we are going to reject that our null hypothesis is true, and approve of the fact that sex and voting are dependent in the town. Chi-Square Test (χ2)
Summary of Formulas: Goodness of Fit: Df = number of categories – 1 Test for Independence (Contingency Table) Df = (rows-1)(columns-1) Chi-Square Test (χ2)