Unit 8: Energy and Phase Changes
Unit 8: Energy and Phase Changes. Do Now: *HW Out *Prepare for Quiz. Aim 8.2: Phase Changes and Entropy. Think-Pair-Share. Review: Phase Change Names. Entropy – is a measure of the disorder/randomness/ unorganization of a substance in its environment

Unit 8: Energy and Phase Changes
E N D
Presentation Transcript
Unit 8: Energy and Phase Changes Do Now: *HW Out *Prepare for Quiz Aim 8.2: Phase Changes and Entropy
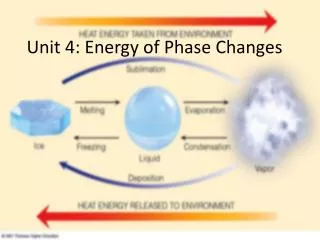
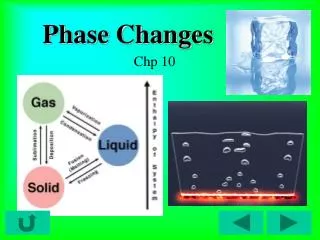
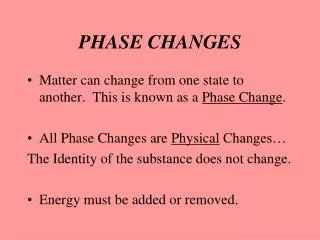
Entropy – is a measure of the disorder/randomness/unorganization of a substance in its environment 1. The more randomly arranged and unorganized a substance, the more entropy it has. 2. The more molecules that are present, the more entropy the substance has. 3. All physical substances and their surroundings move towards greater entropy (disorder/randomness) due to their random movements. Ex: Gas particles fill a container rather than huddling together. 4. Increasing energy/temperature/heat will increase the entropy of a substance.
Part 1: Annotating and Understanding the Graph a) Write S, G, and L on the line segments of the graph where the substance is ONLY solid, liquid, or gas and is NOT undergoing a phase change. b) Write L S & GL on the line segments of the graph where the substance is undergoing a phase change. c) Write MP &BP on the y-axis next to the temperatures of the melting point (MP) and boiling point (BP)
1. What temperature is the melting point of substance X? __________ °C 2. What temperature is the boiling point of substance X? __________ °C 3. How long is this substance a liquid, only? ___________________ minutes 4. At which point in the graph is the substance melting? a) AB b) BC c) CD d) DE 5. At which point in the graph is the substance decreasing in kinetic energy? a) BC b) AB c) DE
6. Explain, in terms of temperature, whether this graph shows an endothermic or exothermic process. 7. Explain, in terms of particle arrangement and phases, why the entropy decreases between point D and point E. 8. Explain how you can figure out the substance’s melting point (MP) and boiling point (BP) when you look at a phase change diagram.