Download
1 / 25
250 likes | 318 Views
This updated presentation explores carbon data and analytical techniques, identifying temporal instabilities, focusing on ratios of TOR fraction to total carbon. Analysis includes median and interquartile range across the network, detecting changes in organic fractions over time. The comparison of OC and EC against different modules, such as PESA and HIPS, reveals interesting trends. Measurements of OC/OH ratios hint at anticipation of instrumentation changes. The text investigates trends in EC/LRNC and gravimetric fine mass, shedding light on the impact of instrumentation changes post-January 2005.

E N D
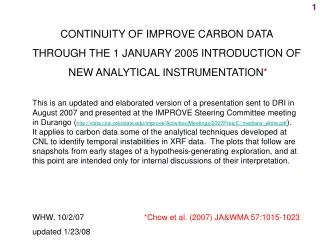
CONTINUITY OF IMPROVE CARBON DATA THROUGH THE 1 JANUARY 2005 INTRODUCTION OF NEW ANALYTICAL INSTRUMENTATION* This is an updated and elaborated version of a presentation sent to DRI in August 2007 and presented at the IMPROVE Steering Committee meeting in Durango (http://vista.cira.colostate.edu/improve/Activities/Meetings/2007Pres/C_medians_white.pdf). It applies to carbon data some of the analytical techniques developed at CNL to identify temporal instabilities in XRF data. The plots that follow are snapshots from early stages of a hypothesis-generating exploration, and at this point are intended only for internal discussions of their interpretation. WHW, 10/2/07 *Chow et al. (2007) JA&WMA 57:1015-1023 updated 1/23/08
We begin with time series of the ratios TOR fraction / total carbon (g/g or mol/mol). VIEWS “raw”, downloaded 9/07 VIEWS “preliminary”, downloaded 9/07 (Babs is not included in VIEWS preliminary data, and so was obtained from CNL’s internal files.) Scales vary from fraction to fraction, but grid intervals remain constant (as a visual cue to the differences).
MEDIAN AND INTERQUARTILE RANGE ENTIRE NETWORK, ALL VALID DATA 75th percentile 25th percentile
MEDIAN AND INTERQUARTILE RANGE ENTIRE NETWORK, ALL VALID DATA 2001-2003 “NORMAL”: for each week {1,2,…,52}, the median of 24h medians from that week during 2001-2003
MEDIAN AND INTERQUARTILE RANGE ENTIRE NETWORK, ALL VALID DATA unsynchronized sampling during 2/week 1/3day transition: data excluded IMPROVE IMPROVE_A (DRI/OGC) (DRI Model 2001) version 1 | version 2 samplers
MEDIAN AND INTERQUARTILE RANGE ENTIRE NETWORK, ALL VALID DATA
MEDIAN AND INTERQUARTILE RANGE ENTIRE NETWORK, ALL VALID DATA
MEDIAN AND INTERQUARTILE RANGE ENTIRE NETWORK, ALL VALID DATA
MEDIAN AND INTERQUARTILE RANGE ENTIRE NETWORK, ALL VALID DATA
MEDIAN AND INTERQUARTILE RANGE ENTIRE NETWORK, ALL VALID DATA
MEDIAN AND INTERQUARTILE RANGE ENTIRE NETWORK, ALL VALID DATA
MEDIAN AND INTERQUARTILE RANGE ENTIRE NETWORK, ALL VALID DATA
MEDIAN AND INTERQUARTILE RANGE ENTIRE NETWORK, ALL VALID DATA
MEDIAN AND INTERQUARTILE RANGE ENTIRE NETWORK, ALL VALID DATA
MEDIAN AND INTERQUARTILE RANGE ENTIRE NETWORK, ALL VALID DATA
MEDIAN AND INTERQUARTILE RANGE ENTIRE NETWORK, ALL VALID DATA
The changes in OC and EC are neither abrupt nor dramatic, but the greater regularity of these aggregates makes them noticeable. Winter 2003-4 also appears anomalous.
We have focused on carbon/carbon ratios up to now. Total organic carbon, OC, can also be compared against non-sulfate hydrogen. This is calculated from the A-module PESA measurement of H and the B-module IC measurement of SO4= on the assumption that all sulfate is ammonium sulfate. On the further assumption that ammonium sulfate accounts for all inorganic hydrogen, non-sulfate hydrogen is referred to as organic hydrogen, OH. Total elemental carbon, EC, can be compared against the A-module HIPS (hybrid integrating plate/sphere) measurement of light absorption. These data are submitted by CNL as LRNC (the “NC” stands for non-corrected), and delivered by VIEWS as Babs in the non-standard units (108 m)-1. Of course, each measurement added to the comparisons also carries its own errors and uncertainties.
1 mol/mol 1.5 2 3 mol/mol MEDIAN AND INTERQUARTILE RANGE, ENTIRE NETWORK, ALL VALID DATA
1 mol/mol 1.5 2 3 mol/mol MEDIAN AND INTERQUARTILE RANGE ENTIRE NETWORK, ALL VALID DATA The new measurements report less OC, not only relative to TC, but also relative to OH – estimated wholly independently. Like OP/TC, OC/OH seemed to anticipate the instrumentation change.
5 m2/g g/10m2 10 20 MEDIAN AND INTERQUARTILE RANGE ENTIRE NETWORK, ALL VALID DATA
MEDIAN AND INTERQUARTILE RANGE ENTIRE NETWORK, ALL VALID DATA g/10m2 EC/LRNC trended higher in 2005 than in 2004, but gaps leave the record somewhat ambiguous. 5 m2/g 10 20
MEDIAN AND INTERQUARTILE RANGE ENTIRE NETWORK, ALL VALID DATA Comparison with gravimetric fine mass, considered one of the most reliably accurate of the measurements, gives no clear indication that TC = EC+OC did exhibit any decrease in 2005.