Download
1 / 141
2.05k likes | 3.69k Views
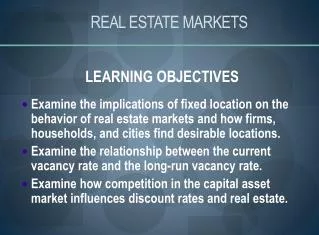
Real Estate Space and Asset Markets. Module 1: Real Estate Investment Analysis. Two Types of Real Estate Markets. A market is a mechanism for the voluntary exchange of goods and services among owners.

E N D
Real Estate Space and Asset Markets Module 1: Real Estate Investment Analysis
Two Types of Real Estate Markets • A market is a mechanism for the voluntary exchange of goods and services among owners. • There are two types of real estate markets for our consideration in this course. They are: • Real Estate Space Market • Real Estate Asset Market
Real Estate Space Market • The term “space market” is the market for the usage of real property. • In this market, tenants exchange rent with landlords for the right to use land and built space. • This market is often called “the rental market.”
Real Estate Asset Market • The term “asset market” refers to the mechanism for the voluntary exchange of ownership of real property. • In this market, buyers exchange money with sellers for ownership rights to land and built space (real estate). • This market is often called “the property market.”
Let’s first consider several characteristics of “space markets.” After that, we will look at the characteristics of “asset markets.”
Characteristics of the Space Market: Demand and Supply • Demand side of this type of market includes individuals, households, or firms who want to use space for consumption or production purposes. • Supply side of this type of market includes real estate owners who “rent” (used as a verb here) space to tenants.
Characteristics of the Space Market: Rent • “Rent” as noun refers to the price of the right to use space for a period of time. • May be measured in $ per square foot per year (office space), $ per month per unit (apartments) or various other methods. • Determined by the interaction of supply and demand forces.
Characteristics of the Space Market: Equilibrium • When the quantity of space demanded equals the quantity supplied, the market is in equilibrium. • The observed rent at equilibrium is called market rent.
Characteristics of the Space Market: Market Rent Changes • The principle of supply and demand states that equilibrium price in a market is directly related to changes in demand and inversely related to changes in supply. • Market rent, therefore, is directly related to changes in demand and inversely related to changes in supply.
Characteristics of the Space Market: Segmentation • The real estate space market is highly segmented, meaning that it tends to be local in nature and specialized by property usage. • Within each segment, or submarket, the same good may have a different equilibrium price. • Market rent for office space may differ significantly between Seattle and Miami. • Market rent for retail space and warehouse space in the same city may different dramatically.
Why is the Real Estate Space Market Segmented? • On the demand side: • Users require specific types of space • Users require specific locations • On the supply side: • Buildings are built for specific uses • Buildings are fixed in location • Thus, we often talk of “geographic” or “property usage” submarkets.
Characteristics of the Space Market: Demand Curve • The typical space market (or submarket) has a “downward sloping” demand curve. $25 $20 Real Estate Demand Curve REAL RENT $15 $10 $5 3.5 4 4.5 5 5.5 6 6.5 QUANTITY OF SPACE (Mil. SF)
Characteristics of the Space Market: “Kinked” Supply • The typical space market (or submarket) has a “kinked” supply curve. $25 REAL ESTATE SUPPLY CURVE $20 KINK REAL RENT $15 EXISTING $10 QUANTITY $5 3.5 4 4.5 5 5.5 6 6.5 QUANTITY OF SPACE (Mil SF)
Characteristics of the Space Market: Why these shapes? • The shape of the demand curve makes sense when we consider that users will prefer more space when prices are low than they will when prices are high. • The shape of the supply curve (kinked) makes sense when we consider that the amount of built space is fixed in the short run because it takes a long time to add new space and because existing space lasts a long time.
Characteristics of the Space Market: Where is the Kink? • The kink occurs at the price equal to the marginal cost of adding new space to the submarket. • From basic economics, we know that the supply function for a competitively produced product equals the marginal cost function. • The marginal cost of built space includes site acquisition costs, construction costs, and the developer’s necessary profits.
Characteristics of the Space Market: Impact of the Kink • Placing the supply and demand curves on the same graph, we can see the impact of the kink on equilibrium prices in a submarket. As demand increases from D0 to D1, equilibrium price increases from about $13 to about $16. If demand continues to increase to D2, the price remains at $16 as new space is brought online by suppliers (S2).
Some Important Observations • In submarkets with rising long-run marginal costs (rising land prices make the next building more expensive than the prior one), the supply curve is increasing beyond the existing supply quantity. • In submarkets with falling long-run marginal costs (the next building is cheaper to construct than the prior one), the supply curve is decreasing beyond the existing supply quantity. • In most U.S. space submarkets, the supply curve is flat beyond the existing supply quantity because the next building probably costs the same as the previous one (in real terms).
Example of Space Market Dynamics: Cincinnati, Ohio • In the mid 1980’s, the market rent for office space was $16 per square foot per year with about 5 million square feet of space. • In the late 1980’s, developers increased supply by 1 million square feet in anticipation of increased demand. (S1 to S2) • The demand increase did not materialize and rent fell to about $13. • In the recession of the early 1990’s, demand fell from D1 to D0 and rents fell further to about $10.
Characteristics of the Asset Market: • “Asset market” refers to the market for the ownership of real estate assets (land and the buildings on it) rather than the use of space in real estate assets. • Buyers in this market purchase real estate in expectation of receiving future cash flows (rent paid by tenants). • These buyers could buy other kinds of assets (stocks, bonds, etc.) that would also produce future earnings. • In this sense, the real estate asset market is really a part of the larger capital market.
Overview of Capital Markets • Capital markets can be divided into four categories • Public equity markets • Private equity markets • Public debt markets • Private equity markets • Where do real estate assets fit? • In all four categories, in some fashion!
Characteristics of Capital Markets • Public markets are more liquid than private markets and thus are more informationally efficient. • Private markets are usually for transactions involving “whole” assets rather than shares of assets (like stocks) as we typically see in public markets. • Debt assets give their owners the rights to future cash flows to be paid by borrowers on loans. • Equity assets give their owners the rights to the residual cash flows generated by an underlying asset after other claim holders (including debtors) have been paid.
Pricing Real Estate Assets • Commercial property prices are typically quoted in terms of “Cap Rates” (short for “capitalization rates”) • Also known as overall rate (OAR) • Defined as:
Characteristics of Cap Rates • Cap Rate can be thought of as: • Current yield on the investment • Inverse of a “price/earnings” ratio • Three major determinants of the cap rate are: • Opportunity Cost of Capital - from the capital market. Considers how much investors could earn on other types of capital assets. Higher OCC implies higher cap rate. • Growth Expectations – from the space market. Considers how much investors think net cash flows will increase in the future. Higher growth implies lower cap rate. • Risk – from both the space and capital markets. Considers how risky a property is relative to other properties and other asset types. Higher risk implies higher cap rate.
Is the Asset Market Segmented? No (not very) • “Physical Capital” = Real physical assets that produce real goods or services over an extended period of time. • “Financial Capital” = Money. • Physical capital is specific and relatively immobile. • Financial capital is fungible (homogeneous) and very mobile. • In the real estate asset market, financial capital is used to purchase physical capital assets. • The real estate space market deals with physical capital. • The real estate asset market deals with financial capital. • Financial capital can quickly and easily flow from a Manhattan office building to a Chicago office building or a Dallas apartment building. Returns are returns are returns, because $$$ are $$$ are $$$, whether those $$$ come from New York office rents, Chicago office rents, or Dallas apartment rents. Therefore: • THE REAL ESTATE ASSET MARKET IS NOT SEGMENTED LIKE THE SPACE MARKET
The Real Estate Asset Market is Actually Quite “Integrated” • By this, we mean that asset prices are quite similar across different asset types, as shown in the graph of cap rates.
What is the overall magnitude of real estate in the capital market? • Real Estate Assets account for: • 50% of all Private Debt • 15% of all Public Debt • 85% of all Private Equity • 15% of all Public Equity
Another view of real estate in the capital market • Real estate accounts for about 40% of total investable capital in the U.S., distributed as: • 3% private commercial mortgages • 1% CMBS • 4% RMBS • 5% private residential mortgages • 12% residential property equity • 7% commercial property equity • 3% agricultural/timberland • 1% REITs
The Real Estate System Module 3: Real Estate Investment Analysis
What Links the Asset and Space Markets? • The real asset and space markets discussed in the previous module are linked together by the development industry. • The manner in which the development industry accomplishes this complex task is the focus of this module. • The development industry, the real estate asset market, and the real estate space market together form the real estate system.
Property Development Industry • Property development is a creative,entrepreneurial process characterized by… • Vision • Greed • Cooperation • Risk (Some of the most entertaining features of American capitalism.)
Development is highly cyclical. • Buildings are “long-lived” assets, it is only the demand for new built space that supports the development industry. • Because this demand is sensitive to general economic changes, the development industry is subject to “boom-bust” cycles.
Financial Resources New Built Space Development Industry Physical Resources Where does Development fit in the Real Estate System? • The development industry is the converter of financial capital into physical capital.
An Overview of the Real Estate System • In addition to converting financial capital into physical capital, the development industry serves as a feedback loop from the asset market to the space market, adding to the supply side of the space market.
The 4-Quadrant Model • To explain the long-run equilibrium simultaneously between and within the asset and space markets requires a more detailed model than the simple supply/demand model. • We will consider the DisPasquale-Wheaton “4-Quadrant Model” that depicts four distinct relationships simultaneously. • The model is really nothing more than 4 simple graphs shown with a dashed rectangle linking them together.
A Personal Note: • My eyes glazed over and I started sweating profusely the first time I looked at this model and heard one of its authors discuss it at an academic conference, but it’s really not so bad when you understand its component parts. • Once I took it apart and put it back together, I discovered it is a pretty clever way to describe about how things “work” in real estate markets. • Our text book authors do a great job of explaining the model, but it may take several “readings” before you fully grasp it.
The 4-Q’s in the 4-Quadrant Model • The four main issues addressed by the model are: • How are rents determined in the space market? (NE quadrant) • How are properties valued in the asset market? (NW quadrant) • What determines the amount of new construction? (SW quadrant) • How is new construction related to the existing stock of space? (SE quadrant)
The 4-Quadrant Model Notice the dashed rectangle Rent $ Asset Market: Valuation D Space Market: Rent Determination D R* P* Q* Price $ Stock SF Asset Market: Construction C* Space Market: Stock Determination Construction SF
Northeast Quadrant: Rent Determination • Horizontal axis is the physical stock of space in the market in square feet. • Vertical axis is the rent for space in $ per square foot per year. • Demand for space is shown as the downward sloping line, just as in the familiar supply/demand model. • Existing space is shown as Q* • Equilibrium rent is shown as R*
Northwest Quadrant: Valuation • Horizontal axis is price per square foot of space in the asset market. • Vertical axis is the rent per square foot of space. • The line represents the cap rate, which we know expresses the price of real estate as a yield measure. • The equilibrium price is shown as P* • Note the we are assuming that prices increase as we move left along the horizontal axis in this quadrant.
Southwest Quadrant: Construction • Horizontal axis is price per square foot of space. • Vertical axis is the amount or rate of construction activity. • The line represents the relationship between property values (prices) and construction activity. • The equilibrium amount of construction activity is shown as C* • Note that we are assuming that price increases as we move left on the horizontal axis and that construction increases as we move down the vertical axis.
Southeast Quadrant: Stock Adjustment • Horizontal axis is the physical stock of space in the market in square feet. • Vertical axis is the amount or rate of construction activity. • The line relates the average rate of construction per year to the total stock of space that can be maintained in the market. • The equilibrium level of supply of built space is shown as Q*
What’s the Big Deal about the 4Q Model? • The 4-Quadrant model helps explain Boom and Bust Cycles in Real Estate Markets. • Boom means that space markets see an extended rise in occupancy and rents. • Bust means that space markets see an extended period of falling occupancy and rents. • Similarly, property prices (in the asset market) tend to exhibit periods of rising and falling prices corresponding to ups and downs in the space market.
Demand increases can trigger a boom-bust cycle • Let’s use the model to see how an increase in demand can lead to a boom-bust cycle. • To do so, we first must understand how the model responds to two types of demand changes • Demand changes in the space market • Demand changes in the asset market
Demand Increase in Space Market • Let the line DD shift to DD1 resulting in a new equilibrium quantity, Q** • The initial reaction is a dramatic price increase (boom). • To maintain a steady state (long run equilibrium), price and other equilibrium points must change as shown by the new, larger dashed rectangle on the next slide.
The 4-Quadrant Model with a Space Side Demand Increase Rent $ Asset Market: Valuation D1 Space Market: Rent Determination D New steady state price R** D1 D Initial price increase P** Q** Price $ Stock SF Asset Market: Construction Space Market: Stock Determination C** Notice the new, larger, dashed rectangle Construction SF
So, what does the model say? • Initially, a demand increase in the space market would result in a price increase in the asset market, then fall back a bit (bust) as the market returns to its long-run steady state due to new construction. • A demand increase in the space market in the long run results in • a rent increase • a price increase in the property market • an increase construction • an increase equilibrium stock of space
Demand Increase in the Asset Market • Continuing along our path to explaining booms and bust, now we will consider what the model tells us about an increase in demand in the asset or property market. • Such an increase is equivalent to an increase in the price investors are willing to pay for real estate per dollar of rental income, or, equivalently, a decrease in the cap rate. • This situation is shown graphically on the next slide.
The 4-Quadrant Model with an Asset Side Demand Increase Asset Market: Valuation Rent $ Space Market: Rent Determination D 11% Steady state price increase 8% D R** Initial price increase Q** Price $ P** Stock SF Asset Market: Construction Space Market: Stock Determination C** Construction SF
Now what does the model say? • Initially, prices would rise dramatically (boom), but then fall back a bit (bust) as the market returns to its long-run steady state due to new construction. • An increase in demand in the asset market (lower cap rate) in the long run leads to • An increase in prices • An increase in construction • An increase in equilibrium stock of space • A decrease in equilibrium rent