GDP
GDP. The Gross Domestic Product. GDP.


GDP
E N D
Presentation Transcript
GDP The Gross Domestic Product
GDP When considering the health of a human being you might look to such health measures as temperature, blood pressure, and pulse. When the whole national economy is studied some measures of economic “health” are collected in what are called the national income and product accounts – the NIPA. “To get a gripa, look at the NIPA.” One of the main economic measures observed is the Gross Domestic Product. The GDP is total market value of all final goods and services produced in the economy during a certain period of time. GDP is a measure of production!
GDP Some examples of production in the US are: Cars, beer, pop, houses, hair cuts, books, movies, music, hotdogs, cheese,… what do you want to include on the list – oh, snicker bars and ice cream, apples and oranges, cookies and milk…peanuts and greeting cards…. If you made a list of all the items produced in the US is a year I think the list would stretch from here to the MOON. A lot of stuff is made in the US each year.
Example of GDP calculation In a very simple example of calculating GDP say we only produce bread in the US. We might have Year Quantity (loaves) Price per loaf GDP 2004 10 $1 $10 2005 15 $1 $15 2006 20 $1.10 $22 So to get the GDP, the quantity of goods produced is multiplied by the price.
Another example of GDP calc • Say bread and cheese are produced. We might have • Bread in loaves Cheese in pounds • Year Q P Q P GDP • 10 $1 15 $0.50 10+7.50=$17.50 • 2005 15 $1 17 $1 15+17=$32.00 • 2006 20 $1.10 25 $1 22+25=$47.00
GDP Calc The list of items produced in the US economy would stretch from here to the moon - a long list - and would be hard to make sense of so we multiply the units produced by market price and talk about production in dollar terms. So the GDP is 1 number that we look to as an indicator of economic health. Changes in the number are studied. GDP is in the neighborhood of $14,000,000,000,000, or 14 trillion dollars, in the US in a years time in the year 2006.
Expenditure Approach There are many ways to take your temperature, right? Under the tongue, or in your ear, or up your, uh,…, uh,…, up your,…., sleeve, yea sleeve to get at your underarm. We have the same thing with GDP. One approach is the Expenditure approach and here we look at the 4 basic sectors of the economy and group the goods and services by the sector that takes them (by buying them). Remember the sectors are households, businesses, governments and the rest of the world.
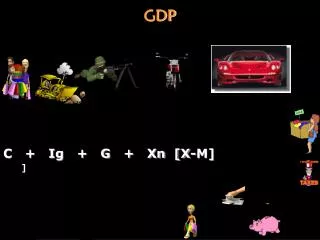
Expenditure approach to GDP The spending, or expenditure, approach to measuring GDP organizes the goods and services into 4 groups, by type of buyer: 1) C - Personal Consumption expenditure on goods and services, stuff bought by households, 2) Ig – Gross private domestic Investment goods like equipment, buildings - stuff bought by businesses, and it also includes production not sold – changes in inventory. 3) G - Government expenditure on goods and services like roads and teachers and police and . 4) Xn - exports minus imports - stuff traded with foreigners
Be careful with government! In the GDP measure government expenditure only includes payments when the government buys a good or service - the government budget is larger than this because the government does more than just buy goods and services. When the government builds a bridge we get a good. When the government sends aid to victims of a typhoon in Asia it is a good thing, but not a payment for a good or service.
Why subtract imports We include exports because the stuff is produced here, even though it is sold elsewhere. BUT, we subtract imports for a good reason as well. When C, I and G are measured it is easier to ignore at that point if the item is domestic or foreign and then subtract later in a lump sum the amount of imports. Consumption, for example, as measured includes imports, so we subtract it out later and talk of NET EXPORTS. Our production measure – GDP – just looks at what is produced here. Our measurement initially includes production elsewhere for expediency, so we subtract it out later.
Notes about GDP So, GDP = C + I + G + Xn. On the following few screens we will point out some of the details about what GDP does and does not include. Specially, we mention 1) intermediate goods are not included, 2) Financial transactions are not included, 3) sale of used items not included, 4) household production not included, and 5) illegal production or legal production not reported is not included.
GDP is only final goods and services As an example say General Motors buys $2000 worth of steel to put in a car. Then GM sells the car for $15,000. GDP is not 17,000 here. The steel sale is called an intermediate sale because the item, steel, is used in the production of another item. The value of the steel is reflected in the value of the car. Counting the steel sale would mean we have double counted the value of steel. GM has taken steel (and other inputs) and has ADDED VALUE by reforming the inputs into an output.
Financial transactions Financial transactions like buying stocks or the government giving social security to recipients is not part of GDP. These transactions are transfers from one individual to another. Nothing has been created. The difference here is that if you buy a car from GM, for example, you transfer them money as well, but you do so because the car was created. Financial transactions merely shuffle around to new players the existing funds. NOTE: the transfer is not directly part of GDP. But households, for example, that get social security payments buy newly produced products. This would be an influence on GDP, BUT NOT part of the direct measurement. Here our focus is measurement.
GDP is a measure of production Although it may seem we are looking at sales to get the GDP, we really want to focus on the production. Much of what is produced this year is sold, and if it isn’t we add it to inventory and call it an addition to inventory under investment. But not all sales are for things that were produced this year. You may have bought a used car that was produced in 2000. Including the sale in 2007 GDP would not be good because the car wasn’t made in 2007. So, the sale of used items is not included.
Household production Say you go to the store and buy bread, peanut butter and jelly. Then you go home and produce a PBJ. Your production here is not included in GDP. But if you buy all the same stuff and illegally hire a housemaid, it won’t be counted either. Only if the hire is legal and reported will the production of the PBJ sandwich at your home be counted in GDP because it was part of what the maid did on the job.
Illegal production Items that are illegal in the US, but still produced, are not counted as part of the GDP. During prohibition all the alcohol produced was not counted as part of the GDP.
Income approach to GDP The other side of the spending coin is that someone collects the funds spent by others. The income approach to GDP would have us focus on the income generated and this amount has to equal the GDP from the expenditure approach. Before we saw the functional distribution of income as made of wage and salary of labor, rent of land owners, interest of capital owners , and entrepreneurs getting corporate profit and proprietor’s income. If we add to this taxes on production and imports we have a measure called national income.
Income approach In Major League Baseball there is a team called the Washington Nationals. What is a National? In economics a national is a person who is a citizen of a nation. US citizens are US nationals. US nationals may use some of their resources inside the borders of other countries. In the functional distribution of income, where the resource is used has been ignored. These measures actually include income earned by nationals working in another country and ignores “domestic” work done by foreigners. This functional distribution of income (plus the taxes on production and imports) thus needs to be adjusted before we have the GDP.
Net Foreign Factor income- NFFI Net foreign factor income = US citizens income earned abroad minus foreign citizens income earned in US. Similar to how we included imports in C, I and G in the expenditure approach and subtracted it out later, when wages, rent, interest and profit are earned it includes those values for all nationals, whether the funds are earned in the US or abroad. BUT, GDP is a measure of production within the borders. National income was income of nationals in and out of the border. SOOOOO, we have to subtract out the income of US citizens that was earned abroad. Plus income earned by foreigners working here must be added because they worked in the domestic economy. This means we have national income – NFFI so far in our income approach to GDP.
Consumption of Fixed Capital - depreciation Capital goods are things like large machines, pieces of equipment, and other tools we made to help us make other stuff. These goods do not wear out totally each year, but they wear out gradually over time. But, part of the income generated by production this year is set aside to ultimately replace the worn out equipment. This must be added into national income so income = production value. Finally, we have income approach to GDP = national income – NFFI + depreciation + a fudge factor or statistical discrepancy.
Corporate profit Let’s note that corporate profits usually gets broken up into 3 categories at the national level: Some of the profit is paid in tax, some is given to corporate owners in the form of dividends and the rest is retained, or undistributed by the corporation.
Expenditure approach equal income approach to GDP So, GDP = C + I + G + Xn = national income – NFFI + depreciation + a fudge factor or statistical discrepancy.
Other NIPA accounts Net domestic product = NDP = GDP – depreciation. National income = NDP – statistical discrepancy + NFFI. Personal income = national income - taxes on production and imports – social security contributions – corporate profits tax and undistributed profits + transfer payments (like social security income). Disposable income = personal income – personal taxes and can be either consumed or saved. Note from definition of disposable income that disposable income + personal Taxes = personal income.
RGDP Here we look at why and how the GDP is converted to RGPD.
Potential problem of the GDP measure Let’s start with a very simple example here. Say in our economy only computers are made. Say in year 1 that 10 computers are made and each is sold for $1000. GDP year 1, GDP1 = $1000(10) = $10,000. In year 2 say 12 computers are made and each sells for $1100 for a GDP = GDP2 = $1100(12) = $13200.
Potential problem of the GDP measure Now on the previous screen we could take the percentage change in GDP to see the growth in production. To get the percentage change in anything take (later value - earlier value) and divide by the earlier value. So the % change in GDP = (13200 - 10000)/10000 = .32 or 32%. But wait, we went from 10 to 12 computers or a (12-10)/10 = .2 or 20% increase.
Potential problem of the GDP measure By looking at the % change in GDP it appears output went up 32%. But we know in this simple example output only went up 20%. The reason the GDP went up more than 20% in our example is because the price level also went up. The price level increasing makes it look like GDP went up more than it did. So the price level change can confuse us about the size of the change in the GDP. In fact it is possible that output falls and prices go up so much that GDP increases, while in fact output fell.
Real GDP or RGDP Remember that we take market value in GDP because the list of products is too long. But now using prices may distort the GDP as a measure of production – this is a problem of measurement. Let’s return to the example we had with computers but always use base year prices. The GDP we calculate is called RGDP (say the base year price is $500). RGDP1 = $500(10) = $5,000 RGDP2 = $500(12) = $6,000. The % change in RGDP = (6000 - 5000)/5000 = .2 or 20%. So by using the same prices in both years we only see the % change in output.
RGDP Nominal GDP in year t, or GDP in current dollars, uses the prices in year t. RGDP in year t, or GDP in constant dollars, uses the prices in the base year. Even tough in our simple example we show how RGDP is calculated, when we look at the whole economy a different way is used. Here is how RGDP is calculated RGDPt = (GDPt/price index in year t)100. The price index we use in this calculation is called the GDP deflator. I want you to remember both calculations for getting RGDP.
RGDP RGDP is the real gross domestic product and is a broad measure of production or income in a national economy. RGDP is the total value of all goods and services produced in an economy over a period of time and expressed in terms of value that has been adjusted for the general increase in prices. RGDP in trillions This graph of RGDP is not totally accurate, but has a few features that reflect the true historical record. 10 3 year 1970 2002
Let’s note two things about the graph on the previous screen. 1) Over the long haul, or long term, RGDP has moved upward and this is called economic growth. At this time let’s not concern ourselves with why this is so, let’s just note that it is so. 2) In the short term there are economic fluctuations - ups and downs in the level of RGDP. This shorter term pattern is often called the business cycle.
Remember the long term shows RDGP grow, but in the short term RGDP goes up and down along the long term trend. Again, the short term fluctuations make a pattern called the business cycle. A recession is a fall in RGDP and as a rule of thumb the decline must occur for at least six months in row to be called a recession. The level of RGDP right before the recession is called the peak and when the recession has stopped the RGDP level is at its trough. From that point the economy expands to the next peak and the cycle begins again. Note that each cycle is not of the same length. During the year 2000 the economy experienced a record in that the longest time had passed by without a recession - something like 9 years. We did have a recession since 2000.
When is a recession a depression? When you are the person out of work. :) No, really though, a depression is just a severe or huge recession. The 1929-1933 recession is called the Great Depression, and another severe recession hit around 1937. So the 1930’s where a pretty tough time in the US from the point of view of RGDP declines. Recessions since this time have been much less severe. The 1990-1991 recession was considered tame or mild compared to the experience of the 1930’s. Of course it was hard for some, but we are looking at the big picture here.