Download
1 / 8
80 likes | 319 Views
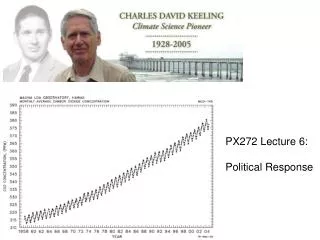
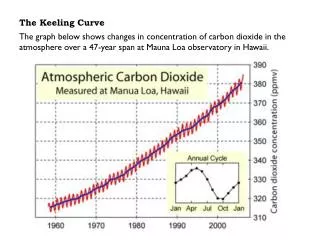
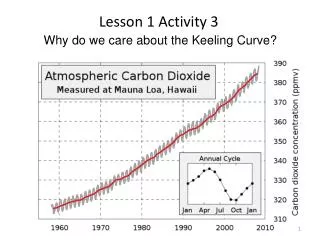
Keeling (1960) observed: “ at the South Pole the observed rate of increase is nearly that to be expected from the combustion of fossil fuel. ”. The Keeling Curve. Source: wikipedia.

E N D
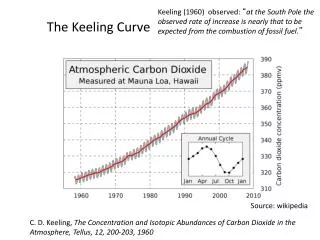
Keeling (1960) observed: “at the South Pole the observed rate of increase is nearly that to be expected from the combustion of fossil fuel.” The Keeling Curve Source: wikipedia C. D. Keeling, The Concentration and Isotopic Abundances of Carbon Dioxide in the Atmosphere, Tellus, 12, 200-203, 1960
65 million yearsPaleocene–Eocene Thermal Maximum (PETM) ΔT=6°C in 20,000:we are projected to get ΔT=4°C in 100 years
Reconstructing CO2 and Temperature 2 million year Globigerinoidessacculifer δ18O δ11B Hönisch et al., (2009) Science 324 pp. 1551 - 1554
Air-trapped in Ice Bubbles (PCO2 and T) 390 Luthi et al. Nature (2008)
2000 yearsof climate Including: tree-ring, marine sediment, speleothem, lacustrine, ice core, coral, and historical documentary series Mann et al. (2008) PNAS 105: 13252-13257