Download
1 / 27
270 likes | 383 Views
This study examines the Prairie Ridge soil profile, focusing on carbon isotopic composition and its relation to soil depth. Expected findings indicated an increase in δ13C with depth, a decrease in C/N ratio, carbon percentage, and nitrogen percentage as soil depth increases. We discuss processes like the Suess effect, soil carbon mixing, and microbial decomposition that influence these patterns. Our results reveal a nuanced understanding of soil organic matter dynamics in relation to anthropogenic disturbances, with significant variations in isotopic composition and nutrient levels.

E N D
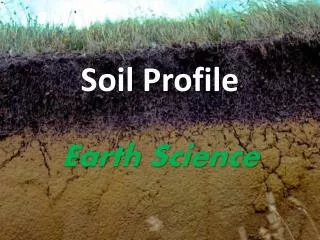
Prairie Ridge Soil Profile Amy Keyworth Jovi Saquing November 2006
Outline • What we expect to see • Why • What we do see
What we expect to see • 13C – increase with depth • C/N – decrease with depth • % C – decrease with depth • % N – decrease with depth
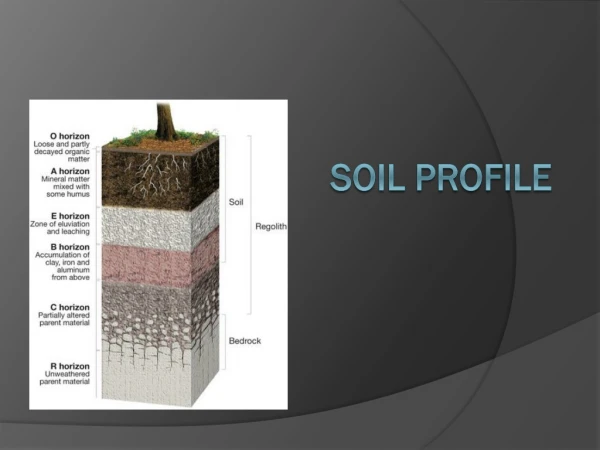
What we expect to see Fig 2 middle. Carbon isotopic composition profiles. Undisturbed site Disturbed (agricultural) site (J.G. Wynn, et al., 2006)
What we expect to see Fig 2. Carbon concentration profiles. Undisturbed site Disturbed (agricultural) site “Kink” in the Cz curve reflects root depth or productivity zone (J.G. Wynn, et al., 2006)
Why we expect to see it • Suess effect • Soil carbon mixing • Preferential microbial decomposition • Kinetic fractionation
Why we expect to see it • Suess effect – • Older, deeper SOM originated when atmospheric 13C was more positive (CO2 was heavier) • From 1744 to 1993, difference in 13C app -1.3 ‰ • Typical soil profile differences = 3 ‰
Suess effect Fig. 1A. Mixing of SOC derived from the modern atmosphere versus that derived from a pre-Industrial Revolution atmosphere. (J.G. Wynn, et al., 2006)
Why we expect to see it • Soil carbon mixing • Surface litter (depleted) vs. root derived (enriched) SOM • Variable biomass inputs (C3 vs. C4 plants) • Some of the carbon incorporated into SOM by these critters has an atmospheric, not SOM source. • Atmospheric C is heavier. Atmospheric CO2 in the soil is 4.4 ‰ heavier than CO2 metabolized by decomposition (Wedin, 1995)
Soil carbon mixing- Surface litter (depleted) vs. root derived (enriched) SOM Fig. 1B. Mixing of leaf litter-derived SOC and root-derived SOC. (J.G. Wynn, et al., 2006)
Soil carbon mixing- Variable biomass inputs (C3 vs. C4 plants) Fig. 1C. Mixing of SOC formed under two different vegetation communities (e.g. C3 vs C4)(slope could vary from positive to negative depending on direction of shift). (J.G. Wynn, et al., 2006)
Why we expect to see it • Preferential microbial decomposition • Lipids, lignin, cellulose - 13C depleted with respect to whole plant • Sugars, amino acids, hemicellulose, pectin - 13C enriched • Lipids and lignin are preferentially accumulated in early decomposition • Works against soil depth enrichment
Why we expect to see it • Kinetic fractionation • Microbes choose lighter C • Microbial respiration of CO2 – 12C preferentially respired • Frequently use Rayleigh distillation analyses (Wynn 2006) • No direct evidence for this (Ehleringer 2000) • Preferential preservation of 13C enriched decomposition products of microbial transformation
Kinetic fractionation Fig. 1D. 13C distillation during decomposing SOM. The gray lines show the model with varying fractionation factors from 0.997 to 0.999. (J.G. Wynn, et al., 2006)
Kinetic fractionationRayleigh distillation • F fraction of remaining soil organic matter (SOC) – approximated by the calculated value of fSOC • 13Cf isotopic composition of SOC when sampled • 13Ci isotopic composition of input from biomass • α fractionation factor between SOC and respired CO2 • e efficiency of microbial assimilation • t fraction of assimilated carbon retained by a stabilized pool of SOM Assumptions by Wynn etal • Open system • All components decompose • Contribute to soil-respired CO2 at same rate with depth • FSOC fSOC
Anthropogenic mixing (agriculture) Wynn fig 9 – various reasons that disturbed land might not conform to nice regression curve in fig 1D A – natural B – introduce C4 plants, enriched in 13C C – Cropping – removes new, low 13C material, leading to surface enrichment D – Erosion – removes upper layer, moving the whole curve up E – Reintroduce soil organic carbon (better management practices) – reverses the trends in C, D, and E
Order of decay of compounds (Melillo 1989) • Loss of C fractions depleted in 13C (p 192) • tannins • non-polar components • water-soluble compounds • lignin, also depleted in 13C is conserved • Cellulose – C fraction enriched in 13C • Lignin • Recalcitrant • Can be enhanced by addition of simple sugars • N may slow lignin decay (Fenn etal 1981, Keyser etal 1978) – not proven
Controls on decay Melillo, et al, 1989 • Temperature • Moisture • Soil texture • Availability of labile C and N
What we do see - results • 13C – increase 0.4 ‰ with to 8 cm (PRS 18 = anomaly) • C/N – increases to 8 cm, then decreases • % C – decrease with depth (PRS 15 = anomaly) • % N – decrease with depth (PRS 15 = anomaly)
What we do see - 13C Increase 0.4 ‰ with to 8 cm (PRS 18 = anomaly)
What we do see - C/N Increases to 8 cm, then decreases
What we do see - % C Decrease with depth (PRS 15 = anomaly)
What we do see - % N Decrease with depth (PRS 15 = anomaly)
Soil FTIR (normalized) Absorbance Wave number (cm-1)
FTIR results • PRS 7 and PRS 15, both surface soils, have similar absorbencies • All soils have peak at wavelength 1032 • All 5 spectra have similar peaks, though not necessarily similar absorbencies • In our bulk and heavy samples, are the mineral spectra masking the organics, as in Poirier’s M-SOM?
Soil FTIR (normalized) Absorbance Wave number (cm-1) • PRS 7 and PRS 15, both surface soils, have similar absorbencies • All soils have peak at wavelength 1032 • All 5 spectra have similar peaks, though not necessarily similar absorbencies • In our bulk and heavy samples, are the mineral spectra masking the organics, as in Poirier’s M-SOM?
PRS 7 and PRS 15, both surface soils, have similar absorbencies • All soils have peak at wavelength 1032 • All 5 spectra have similar peaks, though not necessarily similar absorbencies • In our bulk and heavy samples, are the mineral spectra masking the organics, as in Poirier’s M-SOM?