Download

1 / 28
280 likes | 346 Views
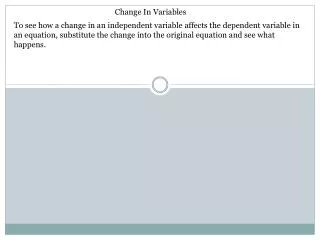
Change in Two Variables in The Operating Statement. Ted Mitchell. A firm has had two changes in its operations from period 1 to period 2 1) It has a $10 reduction in variable cost per unit 2) It has a reduction in its marketing expenses (i.e., budget of $150).

E N D
Change in Two Variables in The Operating Statement Ted Mitchell
A firm has had two changes in its operations from period 1 to period 2 • 1) It has a $10 reduction in variable cost per unit • 2) It has a reduction in its marketing expenses (i.e., budget of $150)
Change in Marketing Expense and Variable Cost Reduces Gross Profit by $200 and Net Profit by $50
Change in Marketing Expense and Variable Cost Reduces Gross Profit by $200 and Net Profit by $50 THE DROP OF $10 IN VARIABLE COST PER UNIT HAD A DIRECT IMPACT ON INCREASING THE DOLLAR MARKUP AND GROSS PROFIT
Change in Marketing Expense and Variable Cost Reduces Gross Profit by $200 and Net Profit by $50 THE DROP OF $150 IN MARKETING EXPENSE HAD DIRECT IMPACT ON INCREASING THE NET PROFIT BY $150
Change in Marketing Expense and Variable Cost Reduces Gross Profit by $200 and Net Profit by $50 THE DROP OF $150 IN MARKETING EXPENSE HAD AN INDIRECT IMPACT ON DECREASING THE QUANTITY SOLD BY 20 UNITS
Change in Marketing Expense and Variable Cost Reduces Gross Profit by $200 and Net Profit by $50 THE LOSS OF 20 UNITS IN SALES HAD DIRECT IMPACT ON DECREASING THE REVENUE, COST OD GOODS SOLD AND THE GROSS PROFIT
Classic Marketing Problem • We can see that the reduction in marketing costs improved the net profit by $150 • We can see that the reduction in variable cost per unit had a dollar impact on gross profit • BUT • What was the dollar impact on the gross profit caused by the change in the quantity sold?
The reduction in marketing effort caused a loss of 20 units in sales volume • Can NOT directly compare quantity changes and dollar change • What was the dollar impact of this loss in quantity sold on gross profit?
Decomposing the $50 reduction in net profit into the two individual effects is best accomplished by first decomposing the $200 dollar reduction in gross profit into the impact on change in Gross Profit by • 1) by change in variable cost ∆V • Or change in dollar markup, ∆D • 2) by change in quantity sold ∆Q
Impact analysis has the big advantage of converting the impact of changing quantity sold into changing dollars of profit • Dollars of Impact are Directly comparable with other direct dollar changes on profits
Remember Impact AnalysisEquation: ∆G = I∆Q+I∆D+J • ∆G = Change in Gross Profit∆G = $4,800 - $5,000 = -$200 • I∆Q = Impact of Change in QuantityI∆Q = Dmin1,2(Q2-Q1) = $50(80-100) =-$1,000 • I∆D = Impact of Change in Dollar MarkupI∆D = Qmin1,2(D2-D1) = 80($60-$50) =$800 • J = the joint or Interactive Impact of the Two Changes (If any)J = ∆G –I∆Q –I∆D = -$200 –(-$1,000) –$800 = 0
Remember Impact AnalysisEquation: ∆G = I∆Q+I∆D+J • ∆G = Change in Gross Profit∆G = $4,800 - $5,000 = -$200 • I∆Q = Impact of Change in QuantityI∆Q = Dmin1,2(Q2-Q1) = $50(80-100) =-$1,000 • I∆D = Impact of Change in Dollar Mark upI∆D = Qmin1,2(D2-D1) = 80($60-$50) =$800 • J = the joint or Interactive Impact of the Two Changes (If any)J = ∆G –I∆Q –I∆D = -$200 –(-$1,000) –$800 = 0
Why do I have to memorize this formula for Impact Analysis? • I could just put one change at a time into the spreadsheet and see the impact of each individual change. • Add up the individual changes and I get the total change to net profit
If there is a single change in an operating statement from period to period then the impact of the change on the bottom line is often easy to measure and understand
Let us Pretend That there was no change in the marketing Expense and sales remained at 100 units in period 2 • A Decrease in the Variable Cost per Unit by $10 Increases Gross Profit and the Net profit by $1,000
Let us pretend that the change in variable cost did NOT happen and The marketing expense was reduced by $150 • The decrease in quantity sold of 20 units results in an decrease in Gross profit of $1,000 and a decrease in Net profit of $850
The original Operating Statement has a $200 reduction in gross profit which is the same as we get adding the individual impacts together!!! Change in Marketing Expense and Variable Cost Reduces profit by $50
If I add up the impact I think I should get the actual change in gross profit and net profit when both changes are made. • Change in Gross Profit due to change in Variable Cost was +$1,000 • Change in Gross profit due to change in Volume sold was -$1,000 • Net Change in Gross Profit is predicted to be $1,000 -$1,000 = 0 • The actual change in Gross profit was -$200
The Reason you don’t just add up the changes on spreadsheet from making changes one at time is • Because you can get the WRONG ANSWER!
Dollar Markup per Unit Sold D2 = $60 GROSS PROFIT IN PERIOD 1 = DOLLAR MARKUP X QUANTITY SOLD = G1 = D1 X Q1 G1 = $50 X 100 =$5,000 D1 =$50 Volume of Units Sold, Q Q2 = 80 Q1 = 100
GROSS PROFIT IN PERIOD 2 = DOLLAR MARKUP X QUANTITY SOLD = G2 = D2 X Q2 G2 = $50 X 100 =$5,000 Dollar Markup per Unit Sold D2 = $60 GROSS PROFIT IN PERIOD 1 = DOLLAR MARKUP X QUANTITY SOLD = G1 = D1 X Q1 G1 = $50 X 100 =$5,000 D1 =$50 Volume of Units Sold, Q Q2 = 80 Q1 = 100
Dollar Markup per Unit Sold This empty space implies there is no Joint or Interaction Effect D2 = $60 D1 =$50 Volume of Units Sold, Q Q2 = 80 Q1 = 100
Dollar Markup per Unit Sold D2 = $60 IMPACT OF REDUCING THE QUANTITY = I∆Q = D1(Q2-Q1) I∆Q = $50(80 -100) =$1,000 D1 =$50 Volume of Units Sold, Q Q2 = 80 Q1 = 100
IMPACT OF INCREASING DOLLAR MARKUP = I∆D = Q2(D2-D1) I∆Q = 80($60 -$50) =+$800 Dollar Markup per Unit Sold D2 = $60 IMPACT OF REDUCING THE QUANTITY = I∆Q = D1(Q2-Q1) I∆Q = $50(80 -100) =-$1,000 D1 =$50 Volume of Units Sold, Q Q2 = 80 Q1 = 100
IMPACT OF INCREASING DOLLAR MARKUP = I∆D = Q2(D2-D1) I∆Q = 80($60 -$50) =+$800 Dollar Markup per Unit Sold D2 = $60 IMPACT OF REDUCING THE QUANTITY = I∆Q = D1(Q2-Q1) I∆Q = $50(80 -100) I∆Q =-$1,000 D1 =$50 THE DIFFERENCE IN THE TWO IMPACTS = $800 -$1000 = -$200 IN Gross Profit Volume of Units Sold, Q Q2 = 80 Q1 = 100