Download
1 / 17
170 likes | 275 Views
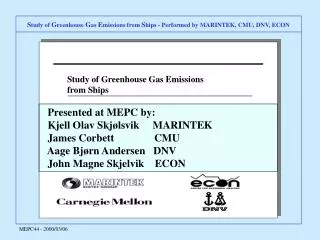
Analysis on the Potential of Reducing Greenhouse Gas Emissions from International Marine Transport. Abstract. Mitsubishi Research Institute Inc. Environment & Energy Division Global Warming Research Group. Objective.

E N D
Analysis on the Potential of Reducing Greenhouse Gas Emissions from International Marine Transport Abstract Mitsubishi Research Institute Inc. Environment & Energy Division Global Warming Research Group
Objective • Analyze the impact of limiting CO2 emissions from international marine fuel consumption in 2050 at 2007 levels
Items of Study • 1.Review of IMO scenarios • (1) Describe the outline of IMO Study • (2) Analyze the impact of freight tonnage increase • (3) Project the future trend of emission factor of transport (CO2 emission / tonne mile freight transport) • 2.Calculation of the degree of change of speed necessary to stabilize CO2 emission • (1) Stabilization by all international marine transport • (2) Stabilization by ships whose flag state is an Annex I country • 3.Analysis of economic measures (ETS) • (1) Impact on the world fleet • (2) Impact on the Japanese fleet
1. Review of IMO scenarios Structure of IMO Study Estimation of future growth trends Estimation of current situation Selection of IPCC Scenarios Ship data based on Lloyd’s Fairplay Navigation data based on AIS Identification of GDP growth in each scenario Estimation of activity data Identification of transport growth in each scenario Estimation of energy consumption and CO2 emission Consideration of technological improvement and speed change Projection of future CO2 emission 6 IPCC scenarios * 3 transport projections * 3 technological improvement projections * 3 speed change projections = 162 scenarios
1. Review of IMO scenariosOutline of IPCC scenarios • Extracts 6 scenarios • A1:High growth scenario • A1F1 :Emphasis on fossil fuel • A1B :Balanced energy • A1T : Emphasis on non-fossil fuel • A2:Differentiated world scenario • B1:Sustainable development scenario • B2:Regional integration scenario Source: IPCC SRES
1. Review of IMO scenarios(1) Outline of IMO scenarios • Category • Ocean-going(Large ships used for large quantities and intercontinental trade) • Coastwise(Ships used in regional (short sea) shipping for international transport; mostly small ships and ferries, etc.) • Container(Container ships of all sizes) • Freight transport • Based on projected GDP growth under IPCC scenarios • 3 growth scenarios are estimated for the years 2020 and 2050 • Technological improvement • E.g. Improvement of propeller efficiency, low-resistance hulls. • 3 scenarios are estimated for the years 2020 and 2050. • Speed change • Anticipates that ships may implement speed reduction due to increase in fuel price • 3 scenarios are estimated for the years 2020 and 2050.
1. Review of IMO scenarios(1) Outline of IMO Study • Efficiency improvement from technological change • Degree of speed change
1. Review of IMO scenarios(1) Outline of IMO Study (CO2 emissions) • Current CO2 emissions • 2007:847*Mt-CO2 • Estimated CO2 emissions • 2020: • 0.85 to 1.7 times 2007 level • 2050: • 0.88 to 8.7 times 2007 level *This Global emission was presented by International Consortium at the 1st Intersessional WG on GHG in Oslo (June ‘08), and amended to 843Mt-CO2 in their final report submitted to MEPC58(Oct. ‘08). Estimated CO2 emissions (Mt-CO2)
1. Review of IMO scenarios(2) Impact of freight tonnage increase • Freight tonnage projection under IMO Study • A1B scenario • Tech. improvement = 0% • Speed change = 0% • Impact of speed change (high reduction, base reduction, low reduction) are analyzed. Conditions (Million GT)
1. Review of IMO scenarios(2) Impact of freight tonnage increase Results • Assumes that shipbuilding capacity will be doubled by 2020 and quadrupled by 2050 • Increase in shipbuilding demand as a result of speed change is about 13% to 14% compared to the case when speed is not reduced.
Low-Low Base-Base High-High 1. Review of IMO scenarios(3) Emission factor of transport (CO2 emission / tonne mile freight transport) • Implementation of high degree of technological improvement and high degree of speed change (case High-High) • CO2 emission per tonne mile is expected to be reduced by 66% by 2050 from 2007. • Implementation of intermediate degree of technological improvement and intermediate degree of speed change (case Base-Base) • CO2 emission per tonne mile is expected to be reduced by 40% by 2050 from 2007.
2. Change of speed necessary to stabilize CO2 emission(1) Stabilization by all international marine transport • 2020 • Speed need to be reduced to the following level (compared to 2007) under IPCC A1 scenario (freight transport: base estimate) • Ocean-going:81% • Coastwise: 81% • Container: 72%
2. Change of speed necessary to stabilize CO2 emission(1) Stabilization by all international marine transport • 2050: • Stabilization under A1 scenario is not possible • Stabilization only possible when a high degree of speed reduction is achieved under low emission (B1, B2) scenarios. (freight transport: base estimate) • Reduction of speed below a certain level results in increase of emissions due to emissions from auxiliary engines, which is proportional to duration of navigation.
2. Change of speed necessary to stabilize CO2 emission(2) Stabilization by ships whose flag state is an Annex I country • Share of ships whose flag state is an Annex I country • Option 1: Constant tonnage…Annex I ships remain fixed at 2006 level (i.e. 5% of all fleet in 2050) • Option 2: Constant proportion…Proportion of Annex I ships remain fixed at 2006 level (i.e. 26% of all fleet in 2050) • Both cases indicate that it is impossible to stabilize emissions at 2007 levels by actions taken by Annex I ships alone • An effort by all ships would be called for, regardless of their flag states Option 1: Constant tonnage at 2006 level (5% of all fleet in 2050) Option 2: Constant proportion at 2006 level (26% of all fleet in 2050)
3.Analysis of economic measures • Objective: Calculate cost of purchase of emission reduction credits (ERCs) in order to stabilize CO2 emissions • Method: • Scenario : IPCC A1B • Cost of ERC: 20 Euro/t-CO2 (low estimate) 60 Euro/t-CO2 (high estimate) • (1) Impact on the global shipping industry
3.Analysis of economic measures (2) Impact on the Japanese shipping industry • Conditions • Freight transport: Proportion of world fleet fixed at 2006 level (12.9%) • Analyzed the effect on corporate performance • Revenue assumed to be proportional to freight transported • Results • Purchase of ERCs to offset emissions in excess of 2007 level can severely affect the operation of the shipping industry • For Base-base (BB) case, the cost is roughly the same level as ordinary profit (which averaged 8.1% from 2001 to 2006) • For High-High case, the cost is roughly the half of ordinary profit
3.Analysis of economic measures (2) Impact on the Japanese shipping industry • Cost of ERC purchase to stabilize emissions at 2007 level (at high estimate of ERCs) can be at the same level as ordinary profit Average ordinary profit to revenue ratio