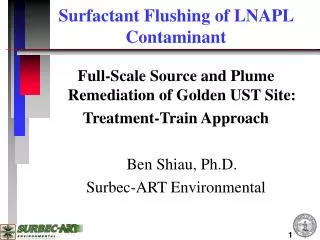
Surfactant Flushing
Surfactant Flushing. 2009 Pilot Study Fueling Point – Military Site Northeastern USA. Jeffrey H. Harwell Asahi Glass Chair of Chemical Engineering The University of Oklahoma Principal Surbec Environmental, LLC. Background. Jet fuel spill discovered in 2006 Probably happened in 2001

Surfactant Flushing
E N D
Presentation Transcript
Surfactant Flushing 2009 Pilot Study Fueling Point – Military Site Northeastern USA Jeffrey H. Harwell Asahi Glass Chair of Chemical Engineering The University of Oklahoma Principal Surbec Environmental, LLC
Background • Jet fuel spill discovered in 2006 • Probably happened in 2001 • Depth to water 44 ft • Sandy aquifer - 20% silt • Drinking water wells within ¼ mile but in deeper aquifer • Estimated 350,000 to 700,000 gal spill
Pilot Study ObjectivesSurfactant Enhanced Aquifer Remediation (SEAR) • Evaluate effectiveness and efficiency • Demonstrate chemical/hydraulic control • Generate design for full-scale implementation
Pilot Study Location • Within the LNAPL plume • generally up-gradient • minimize recontamination • No impact to existing soil vapor extraction system
Surfactant system design Provide proof of concept Geochemistry considerations Heterogeneity issues Optimization of injection strategy Treatability Study
Increasing Salinity Step 1: Formulate Microemulsion I III II Micelle Monomer Monomer Organic Contaminant
Step 1: Formulate Microemulsion Table 1 Microemulsion Phase Behavior Mixture of food grade anionic surfactants
Step 2: Verify Adsorption Losses are Reasonable Table 2 Sorption Studies Very sandy soil; very low adsorption
Step 3: Examine Sensitivity to Phase Separation Table 3Precipitation and Phase Separation Tests Note: * No phase separation within the first day of observation
Step 4: Mobility Ratio Table 4 Viscosity of Different Solutions Note: m(average) is the average viscosity shown in the unit of centipoise (cp)
Step 5: Optimize Injection Sequence Table 5 Summary of 1-D Column Tests *S: surfactant, P: polymer, A: alkaline; PV = pore volume **yellow highlighted: the optimal surfactant candidate based on the performance of NAPL recovery and the recovery mechanism (mainly mobilization)
Pilot Study Overview • Footprint was < 1/8 acre; well spacing of 25 ft. • 2 pore volumes of surfactant at 0.94 wt % • 2 nine-spot patterns • Submersible pumps recover NAPL/water/surfactant • Process equipment • oil/water separator • injection mixing tanks/pumps • injection/extraction manifolds • influent/effluent pumps • carbon vessels
Timeline • Pre-Flush – 1 pore volume • 31 Aug 09 – 6 Sep 09 • Set BioTraps on 3 Sep 09 • Tracer (NaBr) injected 4 – 5 Sep 09 • Surfactant Flush – 2 pore volumes • 6 – 21 Sep 09 • Groundwater sampled on 10 and 17 Sep 09 • Surfactant first observed • EX-02 and OWS on 20 Sep 09 • EX-01 on 23 Sep 09
Timeline • Post Flush - 5 pore volumes • 21 Sep 09 – 1 Nov 09 • Applied vacuum on extraction wells on 25 Sep 09 • Reconfigured injection/extraction on 20 Oct 09 • Groundwater sampled on 1 Oct 09 and 2 Nov 09 • BioTraps 7 Oct 09 • Injected remaining treated water 3 – 6 Nov 09 to empty tanks
Mixing Tanks Size: 18,000 Gallons Transfer Pump
Mixing Tanks Size: 18,000 Gallons Mixer with propeller
Flow Meters and Flow Controllers Flow Meter Flow Control Unit
Quality Control Check NaCl: 0.3-1.7% with 0.1% increment 2.5 min 3 min Phase Behavior Test
Phase Behavior Test NaCl: 0.3-1.7% with 0.1% increment 1 hour
Data Assessment • Pre-Pilot Conditions • API Model estimated 2,300 gal LNAPL • Results • Total LNAPL Recovery was 2,740 gal • API Model estimated140 gal remained
Key Findings • Motivation for full-scale implementation • Significant LNAPL removal - 2,740 gal • Significant reduction in LNAPL thickness • Significant reduction in soil TPH-DRO • Hydraulic control achieved and maintained • No increase in dissolved-phase concentrations • Optimized surfactant formulation
Key Findings • Lessons learned as a result of the pilot study • Heterogeneous NAPL thickness along perimeter • Heterogeneous stratigraphy • Mobilization of fine sand • Emulsification within process equipment • Fixes • Better placement of well screens • Improved well locations • Improved surfactant formulation • Longer residence times in oil/water separator
Full Scale Implementation • Final review with State Regulatory Agency, Military Base Groups on November 12th • Decision for full scale (3.6 acres) made - RFP issued • Implementing in 3 parcels of 1.2 acres each • System installation in May 2010 • Surfactant injection in June 2010 • Post surfactant flush to be finished November 2010