Comparison of Infarct Sizes in Different Groups Following Ischemia/Reperfusion
10 likes | 95 Views
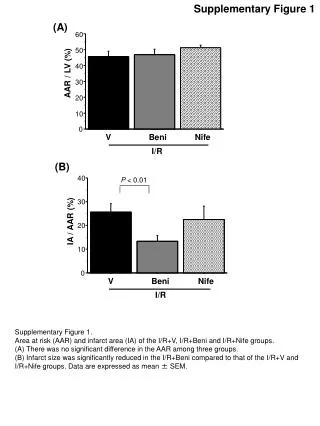
This study compares the area at risk (AAR) and infarct area (IA) among three groups subjected to ischemia/reperfusion with different treatments. Significantly reduced infarct size was observed in the I/R+Beni group compared to I/R+V and I/R+Nife groups. Data presented as mean ± SEM.

Comparison of Infarct Sizes in Different Groups Following Ischemia/Reperfusion
E N D
Presentation Transcript
Supplementary Figure 1 (A) 60 (B) 50 40 AAR / LV (%) 30 20 10 P < 0.01 40 0 30 V Beni Nife IA / AAR (%) I/R 20 10 Supplementary Figure 1. Area at risk (AAR) and infarct area (IA) of the I/R+V, I/R+Beni and I/R+Nife groups. (A) There was no significant difference in the AAR among three groups. (B) Infarct size was significantly reduced in the I/R+Beni compared to that of the I/R+V and I/R+Nife groups. Data are expressed as mean ± SEM. 0 V Beni Nife I/R


