Download
1 / 25
260 likes | 399 Views
Strategy Effectiveness Measures Conceptual Model & Results Chain Examples. Results Chains - Basics. The Basic Components of a Results Chain:. Results Chains - Basics. What is a Results Chain?. Is a diagram of a series of “if…then” statements (“causal”)

E N D
Strategy Effectiveness MeasuresConceptual Model & Results Chain Examples
Results Chains - Basics The Basic Components of a Results Chain:
Results Chains - Basics What is a Results Chain? • Is a diagram of a series of “if…then” statements (“causal”) • Defines how we think a project strategy or activity is going to contribute to reducing a threat and conserving a target • Focuses on the achievement of results – not the execution of activities • Is composed of assumptions that can be tested
Results Chains - Basics Conceptual Model vs. Results Chain • Conceptual Model (i.e., Situation Analysis) • Show the situation today • Identify strategies • Results Chains: • Shows the desired future condition • Start with selected strategies show desired results
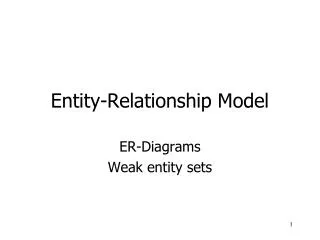
Condor Bioreserve Conceptual Model Who are the key stakeholders with vested interest in the project, what factors are driving critical threats, and what opportunities exist?
Condor Bioreserve What factors in our situation analysis warrant action?
Condor Bioreserve Results Chain
NW Yunnan, China – Fuel wood threat Objective:To reduce by 75% the consumption of fuel wood collected from biologically sensitive forests in the project area in 10 years
NW Yunnan, China – Fuel wood threat NW Yunnan, China • Resources spent on Alternative Energy Strategy • FY 2001 $50,000 • FY2002 $150,000 • FY2003 $350,000 • Total $550,000
NW Yunnan, China – Fuel wood threat • Record of activities completed (e.g., proposals written, grants received, # presentations made, number of household surveys completed). Training on Fireplace, Biogas, and Greenhouse Use in Village
NW Yunnan, China – Fuel wood threat • 1,491 Household Scale Biogas Units • 20 Biogas-Greenhouse Units • 97 Improved Fireplace/Cookstoves • 129 Solar Water Heating Units • 9 Energy demonstration project at schools Alternative energy installations completed (as of June 2003)
NW Yunnan, China – Fuel wood threat • Threat abatement measured by measuring changes in volume of wood consumed in a sample of households • Also, household surveys to collect details on # people, fuel wood uses
NW Yunnan, China – Fuel wood threat • Changes in forest cover calculated from changes in satellite-derived forest-cover maps
NW Yunnan, China – Fuel wood threat • Changes in forest cover recorded from permanent photopoints along ridge top trails
Watch this & remaining slides in Slide Show mode Mesoamerican Reef Fisheries Conceptual Model
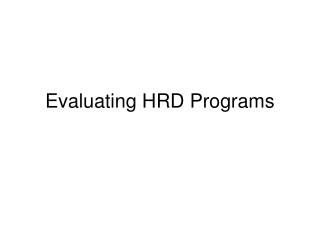
Mesoamerican Reef Fisheries Results Chain Objective FSM3: By 2012 there is at least one concession given to fishermen in Honduras using sustainable practices to have exclusive fishing rights to some species / areas in the priority sites. Indicator FSM3-I1:# of concession agreement drafts prepared and approved by government and the fishermen of the priority sites Objective FSM2: By 2012 30% of the fishermen in the relevant priority sites are aware of and capable of using the sustainable fishing practices identified in FSM1. Indicators: FSM2-I1: % of fishermen aware of sustainable fishing practices; FSM2-l2: % of priority sites fishermen trained in sustainable fishing practices Goal: By 2018, all validated and ecologically functional SPAG sites will maintain the conditions necessary to preserve the species (composition, abundance, proportion of sexes) documented during validation. Indicators: (1) # of species that aggregate in specific periods; (2) # of individuals of each species during the peak of the aggregation period; Goal: By 2018, more than 25% of all coral reef habitat types in the MAR are effectively conserved.* Indicators: (1) Abundance of herbivore species; (2) Abundance of surgeon fish and parrot fish * Working definition of effective conservation exists with multiple components ObjectiveFSM6: By 2018, at least 80 % of the fishermen in 8 MAR Program priority sites comply with all fishing regulations (no-take zones, closed seasons, gear. IndicatorFSM6-I1: # of infractions; & FSM6-I2: # of law enforcement actions (warnings, fines, confiscation, jail) Objective FSM1: By 2011, at least 4 sustainable fisheries practices are identified that could be applied in and around priority sites. Indicator FSM1-I1: # of sustainable fisheries products identified around priority sites for which there is demand ObjectiveFSM5: By 2017, fishermen are collaborating actively in law enforcement activities in 6 priority sites. IndicatorFSM5-I1: # of law enforcement activities (patrolling, reports of infractions) where participation of fishermen is documented Intermediate Results Outcome Results
Objective: By FY 12, live coral cover of reef systems increased to over 50% Indicator: % cover live coral Managing Conservation Projects Results Chain with Strategy, Objectives, Indicators Objective: By FY17, 250,000 ha of LLMA's under effective management in Kimbe Bay Indicator: ha with acceptable Mgmt Effectiveness Scores Objective: By FY12, 4 active spawning aggregation sites closed or with restricted fishing practices Indicator: # of SPAGs closed to fishing Objective: By FY10, design and legally secure a functionally-connected network of LMMAs and MPAs in Kimbe Bay covering 250,000 ha. Indicator: Area (ha) designated as LMMA Outcome Results Intermediate Results Objective: By FY09, Section 38 of the Maritime Zones bill is expanded to establish marine protected areas Indicator: Bill passed/failed Kimbe Bay
Objective: By the end of 2009, Council staff have the knowledge and capacity to implement a pilot test of DAPs. Indicator: Assessment of Capacity of Council Objective: By the end of 2009, the council approves a "good" DAP plan. Criteria include: 1. Comprehensiveness; 2. Minimal Proccessor Quota; 3. Adaptive Management Trust; 4. Gear Switching Provisions Indicator: Quality of DAP Plan Approved (specific criteria established) Objective: By 2010, the council has set Total Allowable Catch (TAC) limits for each stock that are within scientifically credible "sustainable" limits. Indicator: # of Stocks with Credible Catch Limits Objective: By 2012, there are no more than 10 incidences per year of fishermen violating the TAC Limits. Indicator: # of Incidences of TAC Violations Objective: After 2012, all 37 fish stocks in the Ecoregion are fished at levels consistent with an ecolocially sustainable harvest. Indicator: # of Fish Stocks at Sustainable Limit Goal: By 2015, have at least 5.0 groundfish per hour from average party boat CPUE measurements. Indicator: CPUE Levels for Groundfish Intermediate Results Outcome Results
Fire Learning Network – Central Oregon Objective: # of NEPA approved projects increases by a third by 2020. Indicator: # of NEPA approved projects Objective: # of acres treated increases by 30% by 2015 Indicator: # of acres treated Objective:75% Reduction in acres of severe fire and/or unnatural mortality due to insects and disease by 2030 Indicator: # acres of severe fire and/or unnatural mortality Goal: 20-30% of Frequent Fire forests on public are in Condition Class I. Indicator: % Departure from NRV Objective: By 2020 the percent of restoration projects appealed reduced to 25%. Indicator: # of appeals/# of projects Intermediate Results Outcome Results
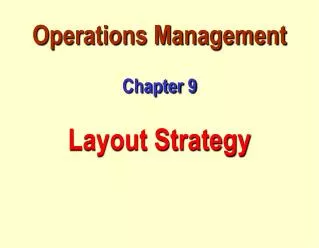
Mackinaw River Initial Conceptual Model with Outreach Strategy
Mackinaw River – paired watershed study Outcome Results Intermediate Results No detectable improvement in water quality or conservation targets in treated watershed as compared to the control. Results demonstrate increased use of Best Management Practices in the treated watershed as compared to the control
Mackinaw River Revised Conceptual Model with new Tile-Drainage Abatement Strategy