Download

1 / 54
550 likes | 732 Views
四次元変分法データ同化手法を用いた 全球海洋環境の再現. 増田周平 , 淡路敏之 , 杉浦望実 , 石川洋一 , 五十嵐弘道 , 日吉善久 , 佐々木祐二 , 土居知将 JAMSTEC Kyoto University. はじめに 海洋環境再現実験

E N D
四次元変分法データ同化手法を用いた 全球海洋環境の再現 増田周平, 淡路敏之, 杉浦望実, 石川洋一,五十嵐弘道, 日吉善久, 佐々木祐二, 土居知将 JAMSTEC Kyoto University
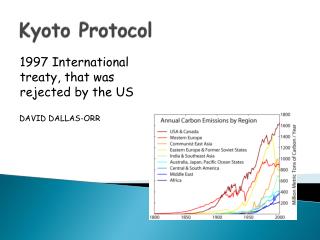
はじめに • 海洋環境再現実験 近年、海洋・気候学の分野でデータ同化手法を用いた海洋観測データと数値モデル計算結果の統合が活発に研究されるようになってきた。その背景には定常観測の難しい海洋亜表層の気候変動現象に対する重要性の認識や計算機科学の発達などがある。(独)海洋研究開発機構では京都大学と共同して四次元変分法アジョイント手法を応用した海洋データ同化システムを構築し、過去50年間にわたる海洋環境の再現を試みた。 • 気候変動メカニズムの解明 得られた海洋環境統合データセットを用いて気候変動現象、とくに季節―経年スケールの現象に着目し、力学解析を行うことでそのメカニズムの解明を目指す。 • 最適観測システム構築への応用 データ同化システムを用いた応用研究として海洋環境再現のためにどの海域を重点的に観測すれば効率が良いかを示唆する観測システム研究を行った。主に赤道太平洋域に焦点を当て、気候変動イベントに対する感度の高い海域を同定し、そこでの観測のインパクトを調べる。
Data Assimilaion An optimal synthesis of observational data and model results. ObservationsNumerical model Merit Truth(real ocean) Equal quality in 4-d continuum DemeritSpatially and temporally sporadic sometimes Unrealistic; Model bias, parameterization Data assimilation can provide analysis fields in superb quality through 4-dimensional dynamical interpolation of in-situ observations.
World’s Ocean Data Synthesis efforts (CLIVAR/GSOP) z-Level Model No Model NCEP ERA40 MOM MIT OPA/NEMO POP HOPE Relax. QSCATGPCP Bias corr. E-P. Relax. Relax. CORE Relax. K-7 GODAS URDG GECCO GFDL SODA Mercator INGV ECMWF DePreSys EN3 4D-Var 3D-Var/OI .25ox.25o 1ox1o DATA 2ox2o
4D-VAR approach • A 4-dimensional variational (4D-VAR) adjoint data assimilation system can provide a dynamically self-consistent dataset. • The obtained products are applicable to dynamical analysis, adjoint sensitivity experiment, Observation System Experiment, ecosystem modeling, forecast study. • High computational cost is required .
Heat flux Wind stress Adjoint sensitivity analysis by using a 4D-VAR ocean DA system surface ΔT=Tmodel- Tobs An adjoint sensitivity analysis moves the ocean representation backward in time! The adjoint sensitivity analysis gives the temporal rate of change of a physical variable in a fixed time and space when model variables (e.g., water temperature, salinity, velocity, or surface air-sea fluxes) are arbitrarily changed in the 4-dimensional continuum of one temporal and three spatial coordinates. This is equivalent to specifying the “sensitivity” of a variable to small perturbations in the parameters governing the oceanic state.
forward • backward Obs. Obs. First guess field Obs. Assimilation window Search of best time trajectory • 4D-VAR data assimilation approach seeks for optimized 4-dimensional model states by minimizing a cost function (differences between observed and model analysis fields). • In that process, Forward & Backward model are executed iteratively within assimilation window. • Assimilation window should be well chosen taking the “memory” of oceanic phenomena of interest into consideration. In general, the longer the memory of the phenomenon is, the longer the assimilation window must be. Best time trajectory
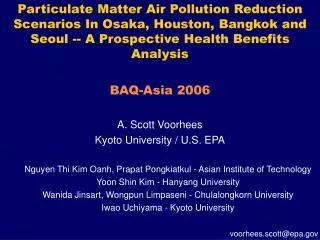
“Bottom-water warming” This bottom-water warming ranges in magnitude from 0.003 to 0.01oC in the Pacific Ocean over the period 1985-1999. Fukasawa et al. (2004),Kawano et al. (2006) Blue Earth (2004) MIRAI RV participate in WOCE revisit in the subarctic North Pacific in 1999 Recent high quality observational surveys conducted during the WOCE and the WOCE revisit have revealed the sobering fact that the deepest waters of the major oceans have warmed significantly during recent decades Such temporal changes are important to understand the variability of abyssal circulation which have implications for large-scale thermohaline transport and thus for the global 3-dimensional heat budget that is presently of vital concern.
System OGCM: GFDL MOM3,quasi-global75oS-80oN horizontal res:1ox1o, vertical res:45 levels Spinup: 1. 3000-year with a climatological forcing (accelerated method) 2. 120-year as climatological seasonal march. 3. 10-year with interannual forcings from NCEP/DOE. Use of optimal parameters: Green’s function method is applied to some physical parameters (Toyoda et al.,20XX). Data sysnthesis: method: strong constrain 4D-VAR adjoint. adjoint coding: by TAMC with some modifications. assimilation window: 50 years (1957-2006) control variables: initial conditions, 10-daily surface fluxes first guess:results from Spinup 3 assimilated elements:OISST,T,S (Ensembles ver.3 + Mirai RV independent dataset ),AVISO SSH anomaly.
Our efforts to reproduce “bottom-water warming” in reanalysis dataset (legacy of 4th研究開発促進アウォード) Green’s function: Optimization of physical parameters Modeling: 1. Short-wave radiation scheme is modified (collaboration with Ocean Circulation Team) 2. BBL scheme, GM scheme 3. Anomalous mending for polar region dynamics, Bland-new QCed Data: Download EN3_v2a_NoCWT_WijffelsTable1XBTCorr with independent RV MIRAI data Deep ocean data synthesis: State-of-the-art adjoint coding. Low resolution compiling for deep ocean obseravations. Assimilation with long-term window Control of model trend (collaboration with Univs.).
推定するパラメータ • Tsujino and Suginohara (2000)は全球で水平一様な鉛直拡散係数の鉛直プロファイルを経験的に推定した。 • Hasumi and Suginohara (1999)は地形性内部波による混合に注目し、海底地形の粗度によるパラメタリゼーションを行った。 • Gargett (1986)は成層状態に依存したパラメタリゼーションを行い(κ~N-α)、OGCMでも使用されている(Cummins et al., 1990)。 • 3つの視点の異なる鉛直拡散パラメタリゼーションの線形結合を考え、観測データをもとに客観的に結合係数を決定する。 • Gargett (1986)の拡散については、 KGGT=10-3N-1 (in cgs)とし、大西洋の恒久躍層に対する議論(e.g., Marzeion et al., 2007)から2000m以深で有効とした。 • 更に、鉛直拡散に寄与する二重拡散 (Schmitt, 1988; Marmorino and Caldwell, 1976)、等密度面・層厚拡散(Redi, 1982; Gent and McWilliams, 1990)のパラメタリゼーション、海底境界層とモデル最深層との拡散係数も推定に加えた。 • これらチューニングパラメータ群の初期推定値はη0=(fTJN,fGGT,fHSM,HHSM,fsf,fdc,Aisp,Athk,KBBL) =(1/3,1/3,1/3, 700, 1, 1,103,103,2*10-4)
実験 • コントロールラン(CTL)として、静止状態から月平均気候値フォーシングを与えて、加速法(Bryan, 1969)を用いて4000年積分後、加速しないで320年積分した。(4000m以深平均の水温トレンドは最後の100年で0.0002℃。) • 320年の(加速なし)部分を9つのパラメータそれぞれについての擾乱実験を行い、以下のグリーン関数法(Menemenlis et al., 2005)により、最適なパラメータ群ηを推定した。 • 線形を仮定( )すると、コスト関数:を最小にするインクリメントは である。 • ここで、xは状態ベクトル(最後の20年の年平均気候値)、yは観測値である。また、R、Bはそれぞれ観測値、制御変数に対する誤差共分散行列(対角)で、R-1の成分(観測の重み)は各モデルグリッドにおける、(グリッドの占める体積)/(観測値の分散)から決定した。 • 観測値は、既存の水温・塩分データ(EN3 by Met Office)に、海洋地球観測船みらいによるCTD/XCTDデータを加えて作成した。このとき、南シナ海・スル海、日本海、メキシコ湾はコストが集中するが、今回のパラメータ調整では修正しきれないモデルバイアスがあるとして観測から除いた。 • 得られた最適値は以下(コスト関数は約5%減)η=(fTJN, fGGT, fHSM, HHSM, fsf, fdc, Aisp, Athk, KBBL) =(0.43,0.08,0.72, 580,0.91,0.91,1.0*103,1.3*103,2.1*10-4)これを用いて同様の320年の積分を行った(ADJ)。また比較としてTsujino, Gargett, Hasumiスキームのみを用いた実験(それぞれTJN,GGT,HSM)を行った。
TJN GGT HSM TJN GGT ADJ HSM ADJ CTL Mean profile of vertical diffusive coefficient. Distributions of VDC at 2000m-depth KADJ=0.43KTJN+0.08KGGT+0.72KHSM+…
Water temperature at 4000-5500m-depth Observation ADJ(Green’s functions) WOA ℃ (left)Tsujino(mid)Gargett(right)Hasumi (Toyoda et al. ‘09JOS annual mtg.)
Cost function Assimilated elements: Temperature, Salinity (ENSEBLES v.3+JAMSTEC observations), SST (reconstructed Reynolds+OISST ver.2), SSH anomaly data (AVISO). First guess is generated from momentum, net heat, shortwave, latent heat flux of NCEP/DOE .
SST Subsurface T (←Argo) SSHa 1991 2006 Optimal Synthesis (dynamical interporation) by 4D-VAR adjoint method Time change of the each component of the cost function, i.e. the difference between simulation and observation. Reduction by iteration processes means progress in synthesis.
Estimated net heat flux (a control variable) NCEP2 RE50 Assim. J-OFURO Comparing with other products NCEPatmospheric reanalysis Reanarysis 50yr • Our results provides a consistent view
Estimated wind stress field(a control variable) Stress Jan Stress Jul Curl Jan Curl Jul Our reanalysis data x ERA40
Climate indices during 1957-2006 Nino3 SST DMI ITF mass transport (8-14Sv) ACC mass transport (130-140Sv) Atlantic MOC (14-20Sv) *Bryden et al. (2005) * * * * Our result provides realistic time series of important climate indices.
Temporal change of global heat content Comparison of year to year changes in heat content from 1960 implies => Our trend would be robust • Comparison with observed heat content trends.
Validation for un-easily-observable variables Comparing with TOGA-TAO ADCP Also, obtained 4-D velocity field is by and large consistent with independent observations by TAO array.
Atlantic 48N Equatorial Pacific CLIVAR/GSOP Intercomparison: Heat Transport Anomaly (PW) Indian Ocean 10S Atlantic 25N
Heat Transport Correlation (5 ys low pass) ECMWF GECCO INGV SODA GODAS K7 Global
Advantage of our dataset Salinity variances Number of obs. for subsurface salinity 0-100m 100-400m 400-700m 700-2000m 2000m- [ ] 1957-1966 [ ] 1967-1976 [ ] 1977-1986 [ ] 1987-1996 [ ] 1997-2006 -- [blue] an OI dataset [yellow] a model free run [red] our 4D-VAR reanalysis The observation number of salinity had been small before ARGO era (~‘00). As a result, the interannual variance of an OI dataset is relatively small for theseperiods. 4D-VAR dataset can resolve this issue thanks to both numerical model & adjoint method. interannual variance (psu2) Toyoda et al. (GSOP’08)
海洋環境再現データセット 作成した統合データのT,Sから見積もったsteric heightの経年変化。
Bottom water warming is of particular interest as it can be closely related to changes in the global thermohaline circulation and the warming trend of the global ocean (e.g., Fukasawa et al., 2004). Water temperature difference between WOCE/WOCE-revisit periods at 4000-5500m-depth is O(0.001-0.003K). Bottom water warming seems to be successfully reproduced in our reanalysis field. Bottom water warming in our reanalysis field Observed heat content Estimation form 50yr DA exp.
Reanalysis data allow us to diagnose the real ocean 統合データセットを利用した海洋貯熱量変動に関する研究(左)、水塊の経年変動研究(下)。 NPZDモデル概念図 Kouketsu et al. (2010) Toyoda et al. (2010)
Reanalysis data allow us to reveal the physical mechanism of climate changes. ±8.6±8.6 ±14.8 (Masuda et al. 2008)
How about the Physical Mechanism? ? • The physical mechanisms governing bottom-water warming are poorly understood since in-situ observations are spatially and temporally sporadic. • The changes in heat storage between WOCE-WOCE revisit imply northward running of the warming signal, but… Difference of the heat storage between WOCE-WOCE revisit observational periods. Our aim is to identify the possible causal dynamics, timescales and pathways involved in the observed bottom-water warming.
forcing Adjoint sensitivity analysis by using a 4D-VAR ocean DA system surface ΔT(Bottom-water warming) An adjoint sensitivity analysis moves the ocean representation backward in time! The adjoint sensitivity analysis gives the temporal rate of change of a physical variable in a fixed time and space when model variables (e.g., water temperature, salinity, velocity, or surface air-sea fluxes) are arbitrarily changed in the 4-dimensional continuum of one temporal and three spatial coordinates. This is equivalent to specifying the “sensitivity” of a variable to small perturbations in the parameters governing the oceanic state.
感度解析 ある時刻t0・地点x0での熱量Qを変えるのに何が効いたのかという問題に対して、時刻t(<t0)に固定して考えると、時刻tからt0までの海面フラックスFと時刻tでの場Xとが候補になる。アジョイント方程式を解くことで各時間ステップtにおけるこれらのアジョイント変数(adF, adX=感度)を得る。それぞれの変化量に感度(=アジョイント変数)をかけて足し合わせたものが、熱量の変化量dQになる。 dQ = sum (dQ/dF_i) dF_i + sum (dQ/dX_i) dX_i = sum adF_i dF_i + sum adX_i dX_i*単位の例種: dQ [cal]温度の場合、 adX_i [cal /K]=[cm3 s] , dX_i [K]熱フラックスの場合、 adF_i [cal /(cal/cm2/s)], dF_i [cal/cm2/s]感度計算によって、adX、adFが求められる。時刻t場所xに温度1K(or フラックス1cal/cm2/s)与えたら、それが時刻t0におけるターゲットのdQのうち何calになるかを定量的に評価できる。 Sugiura (2009)
Results of adjoint sensitivity analysis for a positive temperature anomaly in the abyssal North Pacific ---A contour surface shows bottom-water warming rate when a constant change in water temperature is given--- After 0-year
Results of adjoint sensitivity analysis for a positive temperature anomaly in the abyssal North Pacific ---A contour surface shows bottom-water warming rate when a constant change in water temperature is given--- After 5-year
Results of adjoint sensitivity analysis for a positive temperature anomaly in the abyssal North Pacific ---A contour surface shows bottom-water warming rate when a constant change in water temperature is given--- After 15-year
Results of adjoint sensitivity analysis for a positive temperature anomaly in the abyssal North Pacific ---A contour surface shows bottom-water warming rate when a constant change in water temperature is given--- After 25-year
Results of adjoint sensitivity analysis for a positive temperature anomaly in the abyssal North Pacific ---A contour surface shows bottom-water warming rate when a constant change in water temperature is given--- After 35-year
Results of adjoint sensitivity analysis for a positive temperature anomaly in the abyssal North Pacific ---A contour surface shows bottom-water warming rate when a constant change in water temperature is given--- After 45-year
Tasman Sea New Zealand Antarctica Antarctica Results of adjoint sensitivity analysis for a positive temperature anomaly in the abyssal North Pacific ---Shade shows bottom-water warming rate when a constant change in water temperature is given--- 170oE cross-section160oE cross-section After 48-year
Results of adjoint sensitivity analysis for a positive temperature anomaly in the abyssal North Pacific ---Contour shows bottom-water warming rate when a constant change in surface heat flux is given--- Source region: Antarctic Sea off Adelie Coast Time scale: 40 year in contrast to the previous estimation of O(multi-centennium)!! After 45-year
Possible mechanism for bottom water warming Masuda et al. (2010) WOCE WOCE_rev 底層水温上昇 時間変化 水平移流 鉛直移流 水平拡散 鉛直拡散 (含む地熱効果)
Our scenario should be tested by direct observations… Also, using 4D-VAR data synthesis, sustainable observations is needed to better representation for a global ocean. Argo, revisit cruise is really enhancing the quality of reanalysis products. Atlantic Ocean Africa South America Indian Ocean Antarctica Pacific Ocean Australia S04 line P14S line WOCE sections
0-month -2-month -4-month アジョイント感度解析を用いたNINO3亜表層水温の変動要因の分布(adT)。 観測システム研究 0-month 四次元変分法データ同化システムを利用しアジョイント感度解析を行うことでENSOに関する水温変動をひきおこす水温変化の時間スケール、空間分布を同定した。
アジョイント感度解析から得られた結果を元に、観測システムシミュレーション(同化)実験をおこなった。アジョイント感度解析から得られた結果を元に、観測システムシミュレーション(同化)実験をおこなった。 3:観測システム研究 西部熱帯太平洋の観測網を変化させる(0-100m0-200m)ことで、東部海域における水温構造の再現性に差が生じることを確認した。 Adjoint source region
Summary • 4D-VAR data assimilation method is applied to deep ocean reanalysis experiment to obtain a dynamically-self consistent ocean state estimation from surface to bottom (1967-2006). • The reanalysis dataset is capable of representation of the recent climate change also in the abyssal ocean. • An adjoint sensitivity analysis implies that an increase in the heat input into the Southern Ocean off the Adélie Coast of Antarctica leads to bottom water warming in the North Pacific on a relatively short time scale (within four decades). • An adjoint sensitivity analysis was applied to detect an optimal ocean observation system in the equatorial Pacific. Tentative results show further applications in line with this study are promising.