
Analysis of Guitar Sales Trends (1999-2005)
E N D
Presentation Transcript
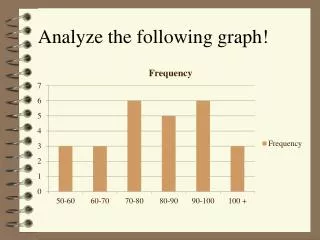
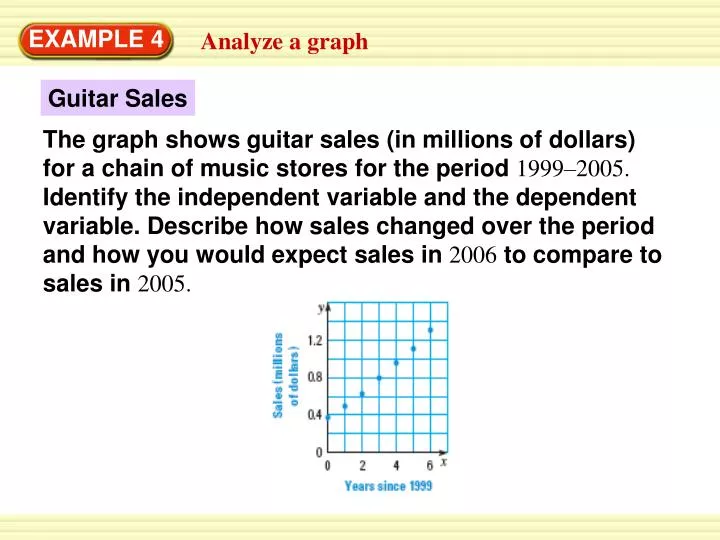
EXAMPLE 4 Analyze a graph Guitar Sales The graph shows guitar sales (in millions of dollars) for a chain of music stores for the period 1999–2005. Identify the independent variable and the dependent variable. Describe how sales changed over the period and how you would expect sales in 2006 to compare to sales in 2005.
EXAMPLE 4 Analyze a graph SOLUTION The independent variable is the number of years since 1999. The dependent variable is the sales (in millions of dollars). The graph shows that sales were increasing. If the trend continued, sales would be greater in 2006 than in 2005.
5. Based on the graph in Example 4, is $1.4 million a reasonable prediction of the chain’s sales for 2006? Explain. REASONING ANSWER Yes; the graph seems to increase about $0.2 million every two years. EXAMPLE 4 for Example 4 GUIDED PRACTICE