METHODOLOGY
Illuminating Household Composition in Low Income Neighborhoods: Measures of Child Wellbeing in Two Parent, Single Parent, Extended, and Non-Parent Families Nola du Toit , Kate Bachtell and Catherine Haggerty. PART 1: ECONOMIC MEASURES. PART 2: OTHER MEASURES. ABSTRACT.

METHODOLOGY
E N D
Presentation Transcript
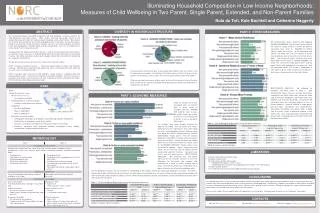
Illuminating Household Composition in Low Income Neighborhoods: Measures of Child Wellbeing in Two Parent, Single Parent, Extended, and Non-Parent Families Nola du Toit, Kate Bachtell and Catherine Haggerty PART 1: ECONOMIC MEASURES PART 2: OTHER MEASURES ABSTRACT DIVERSITY IN HOUSEHOLD STRUCTURE The relationship between household composition and child wellbeing is a primary concern for child advocates and policy makers. Most studies classifying households based on the relationships of parents and then compare single, cohabiting, and married families. We examine the structure of households by considering all people present in the home, not only the parents. Doing so, we find that, among low-income families, more than one third of children share their homes with grandparents, extended family, and non-related adults. Also, 10% of children live in homes where there is no parent present. Using data from the Making Connections Survey, a study of ten low-income urban communities, we examine various measures of child wellbeing while focusing on differences by household structure. We define household structure by the people living in the home and their relationship to a randomly selected child. This poster presents two sets of analysis (i.e. two previous research studies). PART 1 examines economic measures - income per capita, public assistance, and economic hardship. We find that, compared to two parent only homes, households with other adults do less well in terms of economic factors. PART 2 considers other measures of child wellbeing - school readiness, reading to child, and knowing child’s friends. Contrary to the findings for economic variables, with these measures, two parent only homes seem to be worse off, with single parent families and two parent homes that include other adults doing comparatively well. • We examined other factors related to child wellbeing. SCHOOL READINESS: Overall, there is great variety in the mean of school readiness among the different households types (Chart 7). READING TO CHILD: Chart 8 shows these results. All the households with parents are doing well with the majority of homes having someone read to the child at least three times a week. The non-parent homes, however, have lower percentages for this measure. KNOWS FRIENDS: On Chart 9 we see that the single parent homes and two parent homes with grandparents are doing well, while the two parent homes that include a combination of other adults and the single non-parents are doing less well in terms of knowing most of the child’s friends. • MULTIVARIATE ANALYSIS: We collapsed the categories into those shown on Table 2. After controlling for various measures (average age of adult, employment per (adult) capita (log), income per capita (log), presence of grandparent, age of focal child, race, Hispanic, and all female household), we found that the households were not statistically different in terms of school readiness. However, children in single-parent-plus-other-adults households and two-parent-plus-other-adults households have greater odds of being read to at least 3 times a week than children in two-parent only. Also, single-parent-only households had greater odds of knowing most of the child’s friends than two-parent-only families. These pie charts illustrate the types of households with children in the U.S (Chart 1) and the low income households in the Making Connections dataset (Charts 2) when only the parents are considered. Chart 3 shows the variety of adults living in homes with children. When we consider the presence of other adults and classify the home in terms of the focal child, we find that one third of households with children do not fit into the two parent only or single parent only picture. DATA • DATA • Making Connections survey • 10 sites across the U.S. • Low income households • Funded by Annie E. Casey Foundation • Locations tied to community initiatives • Longitudinal • Baseline (2002-2004) • Wave 2 (2005-2007) • Wave 3 (2008-2011) • Information on variety of topics • Demographic information on all people in household (age, gender, employment) • Relationships of all people in home to one another • Questions on randomly selected focal child and all children in household • Numerous substantive areas (economic hardship, employment history, mobility, transportation, neighbourhood cohesion, etc.) When we consider these other households types, we find that there is great variety in economic measures. INCOME PER CAPITA: Chart 4 shows the median income per capita. The data are very skewed due to outliers so we use the log for data analysis. Figure 1: Data Collection Sites The findings show great disparity between the different households, with two parent only homes doing the best and single parent only homes doing less well. Parent/grandparent homes, however, seem to be doing the same as single parent only. PUBLIC ASSISTANCE: Single parents have the greatest proportion using public assistance, while two parents only have the lowest. Among the other households, about half use at least one kind of assistance(Chart 5). ECONOMIC HARDSHIP: Chart 6 shows results for economic hardship. Again, single parent only homes are the worst off, with the highest percent experiencing economic hardship. Two parent only homes have the lowest percent. MULTIVARIATE ANALYSIS: We performed OLS and logistic regression on the economic measures to see if the differences by households type changed after controlling for a group of factors (average age of adults, all female household, race (respondent race is proxy), Hispanic, and at least one employed adults. METHODOLOGY LIMITATIONS • Data not representative of nation's poor • No higher income cases • Missing a lot of variation within groups • Extended family adults = Uncle v. aunt? • Cohabiting partner of parent (not biological parent of child) = non-related adult? • Presence of other children • Part 1 and Part 2 do not have comparable household structure groups For the dependent variables, we also controlled for (depending on the variable), income per capita (log) and public assistance. See Table 1. We found that, after controlling for all these factors, the other types of households were still worse off than the two parent only households with lower income per capita and greater public assistance. With economic hardship, all types except parent and any combination were doing worse than two parent only homes. CONCLUSIONS Our findings show that, first, households with children include many adults that are not typically examined when the focus is on parents only, and second, these other households differ across various measures of child wellbeing. Economically, it appears that children in these other households are worse off compared to two parent only homes. However, when looking at other measures, children are better off in some single households and in homes that include other adults who are not their parents. These results suggest that we need to look at the big picture, not just parents. We need more research on non “traditional” households. CONTACTS Nola du Toit: dutoit-nola@norc.orgKate Bachtell: bachtell-kate@norc.orgCatherine Haggerty: haggerty-cathy@norc.org