Download
1 / 13
130 likes | 263 Views
HAWK - Advanced Advice Targeting System. The Magic inside SoloHealth’s ECO System. Targeted Content. The SoloHealth ECO system leverages many forms of ‘content’ that are presented to the user. The most popular forms are: Text Video Audio Images. Grouping Users.

E N D
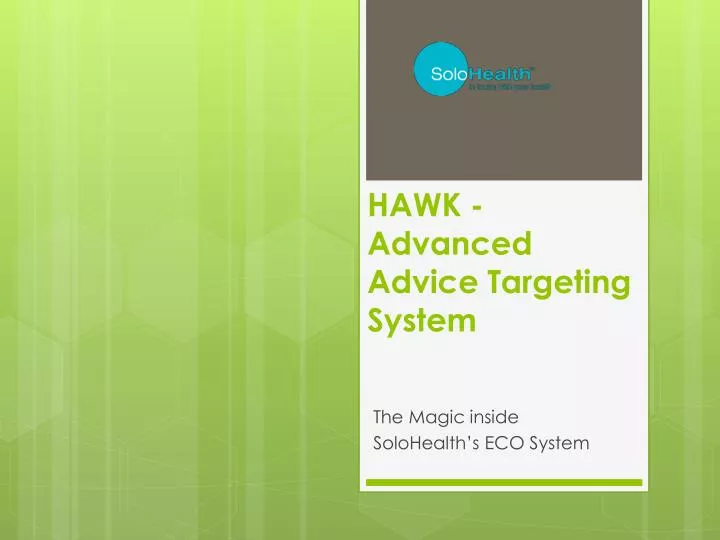
HAWK -Advanced Advice TargetingSystem The Magic inside SoloHealth’s ECO System
Targeted Content • The SoloHealth ECO system leverages many forms of ‘content’ that are presented to the user. The most popular forms are: • Text • Video • Audio • Images
Grouping Users Advice Groups are determined by categorizing user responses into different buckets. These buckets are evaluated to determine the most relevant content to present to the user. SoloHealth’s Health and Wellness Station utilizes the following buckets. • Stress • Physical Activity • Tobacco Usage • Nutrition • Depression • Risk of Cancer • Hypertension • BMI Score • Near Vision • Distance vision • HRA Test • Overall Health
User Responses As users respond to questions or complete tests, the results of these questions and tests are applied to one or more of the buckets. Physical Activity bucket I exercise 5 time a week for at least 30 minutes Low Risk points Nutrition bucket I never eat fruit or vegetables High Risk points
Assigning Buckets The whole system is data driven. Every question and test in the system is assigned to a Health category, and every answer is assigned a risk weight. Choices are 0, 1, 2-3, 4-5, or 6-7. Answer “2-3”, and the physical activity bucket gets assigned 5 risk points. 9 points are bad, 1 point is good. How many times per week do I exercise for at least 30 minutes?
BMI Scores Test scores are also used to calculate risk points to the BMI, Vision, and BP category buckets. A BMI score of 40 of higher calculates a risk score of 11. This allows the system to greatly impact the average and provide targeted content communicating immediate action required. BMI = weight/(height*height)*703
BP Scores Test scores are also used to calculate risk points to the BMI, Vision, and BP category buckets. Because Blood Pressure calculations use both systolic and diastolic results, the system treats them differently and then provides content based on the worse of the two measurements.
Near vision Scores Test scores are also used to calculate risk points to the BMI, Vision, and BP category buckets. The near test score works by starting the user at 100 and subtracting their answer value from each of the screens. For example: An answer of blurry on the first page subtracts 12 points, leaving the user with 88. A subsequent answer of very blurry after that would subtract an additional 27, leaving the user with 61. Since the cutoff considered “poor” or “failing” vision is 89, this means an answer of blurry on the page with the largest text will be considered a fail.
Distance Scores Failing point is considered to be an 85. The test starts with an initial score, we’ll call it X, equal to zero. The best possible score for an eye is 0 – if the user matches all 4 letters correctly on the first screen. The worst possible score is .5 – if the user fails to match any of the letters on the five screens. After the user has attempted to match all 4 of the letters on each screen, the following calculation is made (where c equals the number of letters that were successfully matched). X=X+ (4 – c) * 0.025 The above logic is executed for each screen. After each screen is completed, the next (progressively easier) screen is shown unless the user has matches all 4 letters. In this case, the test ends and X is the user’s score. The distance is represented by a numerical score that is calculated by subtracting 0.025 points for every wrong answer. This numerical score is than divided by .5, and subtracted from 1 to provide a percentage. For instance, if a user fails all of the first screen answers, they would get a score of .025 + .025 + .025 + .025 which equals a score of 0.1 for the first screen of letters. If on the next screen the user gets all of the letters right, they get a score of 0 + 0 + 0 + 0. The combined score for both pages is 0.1. The total score of 0.1 is divided by .5 which equals 0.2. The 0.2 is subtracted from 1.0, giving to distance score of .8 or (80%). A user that fails all of the letters on all five screens, gets a score of (.025 + .025 + .025 + .025 + .025 + .025 + .025 + .025 + .025 + .025 + .025 + .025 + .025 + .025 + .025 + .025 + .025 + .025 + .025 + .025) = 0.5, divided by .5, which equals 1, subtracted from 1 gives them a zero or 0% score.
Distance Scores Alternative Method for determining Distance Score As it turns out there is an easier way to explain and calculate the distance test, which produces the same results. The alternative means of calculating the distance test is by subtracting 5 points for each letter you miss. Since the failing point is anything less than a 85, by missing 3 or more letters you are considered to have failed. Examples for failing: • Press “Too Blurry” on the first distance test, and you lose 20 points giving you a score of 80, which is a failure. • Pick two incorrect letters on the first distance screen, you are prompted with a second screen of larger letters. Pick on incorrect letter of the larger letters, and you are minus 15 points, for a failing score of 85
Scores and buckets Each time a score is added to a bucket, we also increment a bucket counter by 1. After all tests and questions are completed, we get a bucket average, by dividing the total score by the number of risks calculated in that bucket. I never eat fruit or vegetables I eat red meat 7 times a week I eat fast food 5 times a week 8+10+7=25 25/3 = Risk score in Nutrition Group of 8.3
Near vision Scores Each heath category has from 1 to 10 different health advices. The example below of the nutrition advices, contains 3 different advices. In our example of a nutrition score of 8.3, the score falls between 7 and 10, so the nutrition_high media would be presented to the user. Some categories use all 10 ranges, others use 3 or 5 different messages.
Which Advice? Since we are unable to provide the user with ALL of the advices from each group, we rank the bucketed groups and provide the two highest ranging (most risky) advices. In this case Blood Pressure advice followed by Physical Activity Advice would be presented to the user