Download

1 / 32
320 likes | 484 Views
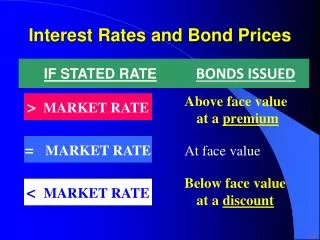
Bond Prices and Yields. Bond Characteristics. Face or par value Coupon rate Zero coupon bond Compounding and payments Indenture Issuers. Provisions of Bonds. Secured or unsecured Registered or bearer bonds (Canada) Call provision Convertible provision

E N D
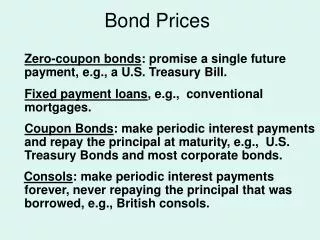
Bond Characteristics • Face or par value • Coupon rate • Zero coupon bond • Compounding and payments • Indenture • Issuers
Provisions of Bonds • Secured or unsecured • Registered or bearer bonds (Canada) • Call provision • Convertible provision • Retractable and extendible (putable) bonds • Floating rate bond
Bond Pricing PB = price of the bond Ct = interest or coupon payments T = number of periods to maturity r = the appropriate semi-annual discount rate • Quoted price vs Cash Price (or “dirty price”) • Accrued interest, day-count convention
Solving for Price: 10-yr, 8% Coupon Bond, FV = $1,000 Ct = 40 (SA) P = 1000 T = 60 periods r = 5% (SA) PB = $810.71
Yields • Yield to maturity • Yield to first call • Bond Equivalent Yield • Effective Annual Yield • Current Yield (Annual Interest/Market Price)
Yield to Maturity Example 10 yr Maturity Coupon Rate = 7% Price = $950 Solve for r = semiannual rate r = 3.8635%
Yield Measures Bond Equivalent Yield 3.86% x 2 = 7.72% Effective Annual Yield (1.0386)2 - 1 = 7.88% Current Yield (Annual Interest/Market Price) $70 / $950 = 7.37 %
Realized Yield versus YTM • Reinvestment Assumptions • Holding Period Return • Changes in rates affects returns • Reinvestment of coupon payments • Change in price of the bond
Holding-Period Return: Single Period where I = interest payment P1 = price in one period P0 = purchase price
Holding-Period Example CR = 8% ; YTM = 8%; N=10 years Semiannual Compounding P0 = $1000 In 6M the rate falls to 7%; P1 =$1068.55 HPR = 10.85% (semiannual)
Realized Compound Yield vs. YTM • Requires actual calculation of reinvestment income • Solve for the Internal Rate of Return using the following: • Future Value: sale price + future value of coupons • Investment: purchase price
Example • Two-year bond selling at par, 10% coupon paid once a year. First coupon is reinvested at 8%. Then:
Price Premium bond 1,000 Discount bond Time 0 Maturity date Price Paths of Coupon Bonds
Zero-Coupon Bonds and Taxation Issues • For constant yields, discount bond prices rise over time and premium bond prices decline over time • Original issue discount bonds’ price appreciation (based on constant yield) is taxed as ordinary income • Price changes stemming from yield changes are taxed as capital gains if the bond is sold
Example: Tax • 30-year bond with 4% coupon rate, issued at an 8% YTM; if sold one year later, when YTM=7%, for a 36% income tax and a 20% capital gains tax: P0=549.69; P1(8%)=553.66; P1(7%)=631.67
Default Risk and Ratings • Rating companies • Moody’s Investor Service • Standard & Poor’s • Canadian Bond Rating Service (CBRS) • Rating Categories • Investment grade • Speculative grade
Factors Used by Rating Companies • Methods are proprietary • Accounting ratios • Coverage ratios • Leverage ratio • Liquidity ratios • Profitability ratios • Cash flow to debt • Other qualitative factors
Protection Against Default • Sinking funds • Subordination of future debt • Dividend restrictions • Collateral
Overview of Term Structure of Interest Rates • Relationship between yield to maturity and maturity • Information on expected future short term rates can be implied from yield curve • The yield curve is a graph that displays the relationship between yield and maturity • Three major theories are proposed to explain the observed yield curve
Important Terms • Bond yields • Spot rates • Forward rates • Yield curve • Term structure or pure yield curve • Structure of forward rates • Using observed rates to predict future rates
Yields Upward Sloping Flat Downward Sloping Maturity Yield Curves
Measuring the term structure- The bootstrapping method • Derive spot rates from bond yields of varying maturities • Treat each coupon as a mini-zero coupon bond • Use bonds of progressively longer maturities, starting from T-bills • “Clean price” method and “dirty price” method
Building zero curve:Boot-strapping • Example: T-bills: 6 month with yield of 4%; One year with yield of 5% • 18 month 5% coupon bond traded at $990 • 2 year 6% coupon bond traded at par This implies y1=2%, y2=5%, y3=2.8664%, y4=3.02% Spot rate:
Example • Observe prices and yields on August 17, 2004; find the spot rate for December 1, 2005 • Observed yields: 3.90%, 4.04% for 6M and 12M, respectively • Observed clean price for 6% bond expiring on December 1, 2005: $1002.29 • Dirty price = clean price + (time elapsed in semesters) x coupon
Bootstrapping example (cont.) • Solving, we find y3=2.08%, or 4.16% annually
Using Spot Rates to price Coupon Bonds • A coupon bond can be viewed as a series of zero coupon bonds • To find the value, each payment is discounted at the zero coupon rate • Once the bond value is found, one can solve for the yield • It’s the reason for which similar maturity and default risk bonds sell at different yields to maturity
Sample Bonds Assuming annual compounding
Solving for the YTM Bond A • Bond Price = 978.54 • YTM = 6.63% Bond B • Price = 1,047.56 • YTM = 6.61%