Business Analytics: Transforming Data for Better Decisions
220 likes | 280 Views
Understand the scientific process of turning data into insight for decision-making. Learn about descriptive, predictive, and prescriptive analytics, as well as the importance of statistics in business. Explore different types of variables and data sources.

Business Analytics: Transforming Data for Better Decisions
E N D
Presentation Transcript
BAN 280 Chapter 1 Introduction to Statistics
BAN stands for Business ANalytics. • Scientific process of transforming data into insight for making better decisions. (INFORMS) • Used for data-driven or fact-based decision making Business Analytics Defined
Three developments spurred recent explosive growth in the use of analytical methods in business applications: • Technological advancesin computing algorithms • Data generation from personal electronic devices, web pages, POS, wireless devices produce incredible amounts of data for businesses. • Technological advances in speed and storage capacity of computers Introduction
Descriptive analytics:Encompasses the set of techniques that describes what has happened in the past. • Descriptive statistics • Data Summary • Data Visualization (data dashboards) • Basic what-if spreadsheet models. A Categorization of Analytical Methods and Models
Predictive analytics:Consists of techniques that use models constructed from past data to predict the future or ascertain the impact of one variable on another based on probabilities. • Regression • Time Series Analysis • Data Mining • Decision Trees • Artificial Neural Networks • Simulation A Categorization of Analytical Methods and Models
Prescriptive Analytics:Indicates a best course of action to take based on known parameters and to a lesser extent probabilities • Optimization Models • Simulation Models • Decision Models A Categorization of Analytical Methods and Models
What is a definition for statistics? The field of Statistics is concerned with the collection, presentation, and analysis of data in order to assist a manager in the decisions making process. • What is the “story” of the data? Why have a class in Statistics?
Two Main Branches of Statistics Inferential Infer or make conclusions from an analysis of the data Descriptive • Describe the data • Central Tendency • Dispersion • Distribution
Statistical Terminology • Population – the collection of ALL entities possessing some characteristic we are interested in. • Sample – some subset of a Population • Population Parameter – a summary measure of some characteristic we are interested in for all entities in a population. • sample statistic – a summary measure computed from a sample and used to estimate a Parameter from the Population where the sample was derived from.
TYPES OF Variables QUALITATIVE • Qualities • Characteristics that are not measurable with an interval or ratio number scale QUANTITATIVE • Data which is numerical in nature • Can use mathematical functions like add, subtract, etc.
QUALITATIVE NOMINAL • Data classified into categories with no order implied • What color are your eyes? • What is your Occupation? • Accountant • Economist • Manager • Teacher • Unemployed (Student) ORDINAL • Categorical data with ordering implied • How was the movie last night? • Excellent • Very Good • Good • Fair • Poor • Rate your Professor • 1 • 2 • 3 • 4 • 5
QUANTITATIVE (Continuous) • Interval Scale • Numerical but no Zero (ie: tempature, change in employment, etc.) • The distant between consecutive values of the interval scale DOES have meaning • You can perform math operations on interval variables • Ratio Scale • Numerical with a meaningful Zero • Weight • Age • Height • Time
Customer Surveys Historical Company Records Competitor Data Manufacturing and Sales Data (internal) MIS issues? IT issues? OPS issues? Sources of Data
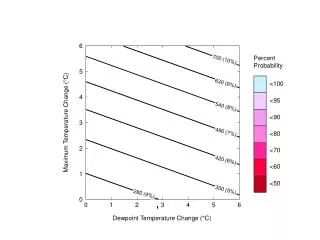
Time Series Data is data collected through time. • Stock prices are an example of time series data. Tomorrow’s starting price for a stock depends on the ending price of that stock today. Stock prices “move” over time so it is important to factor in this effect. • Cross Sectional Data does not have a “time” component • Data collected on a variable at a single point in time. For example you might be interested in doing a study of comparative housing prices for the 8 major cities in June 2000. Types of Data
First step in any analysis is to examine the data • Arrays • Listing the data in ascending or descending order. • Useful in identifying common or outlying values • Tables • Summarizing the data into categories • Useful for visualizing important characteristics of the data • Frequency Distributions • Graphical Representations • Pie and Bar Charts • Histograms Examining the Data
Central Tendency • Mean • Median • Mode • Dispersion • Range • Mean Absolute Deviation • Standard Deviation Descriptive Measures
Why sample? • Cost and time advantages • Population size - Census too cumbersome • Destructive sampling Selecting a sample
Definition • Each member of the population has an equally likely chance of being selected. • sampling with replacement • Basis of most statistical inference simple random sampling (srs)
Sampling error • Error caused because no sample is exactly representative of population • Chance differences that occur when a sample is selected • Non sampling error • Error caused by human. Errors in Collecting Data
Population Parameters are computed from a census of the entire Population and are used to describe some characteristic about the Population you are interested in (X). Population µx sx Parameters
Population Parameters are computed from a census of the entire Population and are used to describe some characteristic about the Population you are interested in (X). Population µx sx Parameters A sample is a subset of a larger Population sample sx sample statistics are computed from sample data and used to estimate Population Parameters statistics