Download
1 / 26
260 likes | 308 Views
Delve into the concepts of utility, diminishing marginal utility, and consumer behavior in economic markets. Learn how consumers optimize utility to make purchasing decisions and explore the relationship between utility, demand curves, and consumer surplus. Discover real-world examples and practical exercises to understand consumer preferences and budget constraints.

E N D
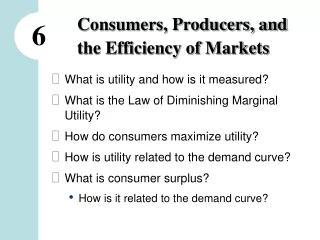
Consumers, Producers, and the Efficiency of Markets 6 • What is utility and how is it measured? • What is the Law of Diminishing Marginal Utility? • How do consumers maximize utility? • How is utility related to the demand curve? • What is consumer surplus? • How is it related to the demand curve?
Measuring Utility • How much utility do you receive from eating donuts?
Law of Diminishing Marginal Utility • The more of a good a person consumes, the smaller the increase in total utility from consuming the good, all else equal • In other words, marginal utility falls as we consume more and more donuts
Finding the Optimal Bundle: An Example • Assume: • Isaac has $10 per week to spend on donuts and cookies • Price of a donut = $1.00 • Price of a cookie = $2.00 • How many of each should Isaac buy?
The Consumer Optimum • Occurs where the marginal utility per dollar spent on each good is equal
The Law of Demand • What happens if the price of a cookie rises to $3.00?
The Law of Demand • What happens if the price of a cookie rises to $3.00? • Quantity of cookies demanded falls
ACTIVE LEARNING 1: Optimal bundle Find the optimal quantity of both goods if the individual has $5 per week to spend on apples and oranges and they each are priced at $1: 9
Willingness to Pay (WTP) A buyer’s willingness to pay for a good is the maximum amount the buyer will pay for that good. WTP measures how much the buyer values the good. Example: 4 buyers’ WTP for an iPod
WTP and the Demand Curve Q:If price of iPod is $200, who will buy an iPod, and what is quantity demanded?
WTP and the Demand Curve Derive the demand schedule: P (price of iPod) Who Buys? Qd $301 & up Nobody 251 – 300 Flea 176 – 250 Anthony, Flea 126 – 175 Chad, Anthony, Flea 0 – 125 John, Chad, Anthony, Flea
Consumer Surplus (CS) Consumer surplus is the amount a buyer is willing to pay minus the buyer actually pays: CS = WTP – P Suppose P = $260. Flea’s CS = $300 – 260 = $40. The others get no CS because they do not buy an iPod at this price. Total CS = $40.
ACTIVE LEARNING 2: Consumer surplus demand curve P A. Find marginal buyer’s WTP at Q = 10. B. Find CS for P = $30. $ Suppose P falls to $20.How much will CS increase due to… C. buyers entering the market D. existing buyers paying lower price Q 14
A More Formal Utility Analysis • Economists can be more specific about the ways in which consumers maximize utility • This material is from the Appendix to Chapter 6
The Budget Constraint: What the Consumer Can Afford • Two goods: pizza and Pepsi • A “consumption bundle” is a particular combination of the goods, e.g., 40 pizzas & 300 pints of Pepsi. • Budget constraint: the limit on the consumption bundles that a consumer can afford
ACTIVE LEARNING 3: Budget constraint The consumer’s income: $1,000 Prices: $10 per pizza, $2 per pint of Pepsi A. If the consumer spends all his income on pizza, how many pizzas does he buy? B. If the consumer spends all his income on Pepsi, how many pints of Pepsi does he buy? C. If the consumer spends $400 on pizza, how many pizzas and Pepsis does he buy? D. Plot each of the bundles from parts A-C on a diagram that measures the quantity of pizza on the horizontal axis and quantity of Pepsi on the vertical axis, then connect the dots. 17
C D The Slope of the Budget Constraint Pepsis From C to D, Y (“rise”) = –100 Pepsis X (“run”) = +20 pizzas Slope = –5 Consumer must give up 5 Pepsis to get another pizza. Pizzas
The Slope of the Budget Constraint • The slope of the budget constraint equals • the rate at which the consumer can trade Pepsi for pizza • the opportunity cost of pizza in terms of Pepsi • the relative price of pizza
ACTIVE LEARNING 4: Exercise Pepsis Show what happens to the budget constraint if: A. Income falls to $800 B. The price of Pepsi rises to $4/pint. Pizzas 20
ACTIVE LEARNING 5: Inferior vs. normal goods • An increase in income increases the quantity demanded of normal goods and reduces the quantity demanded of inferior goods. • Suppose pizza is a normal good but Pepsi is an inferior good. • Use a diagram to show the effects of an increase in income on the consumer’s optimal bundle of pizza and Pepsi. 21
Income and Substitution Effects A fall in the price of Pepsi has two effects on the optimal consumption of both goods. • Income effectA fall in the price of Pepsi boosts the purchasing power of the consumer’s income, allowing him to reach a higher indifference curve. • Substitution effect A fall in the price of Pepsi makes pizza more expensive relative to Pepsi, causes consumer to buy less pizza & more Pepsi.
The Substitution Effect for Substitutes and Complements • The substitution effect is huge when the goods are very close substitutes. • If Pepsi goes on sale, people who are nearly indifferent between Coke and Pepsi will buy mostly Pepsi. • The substitution effect is tiny when goods are nearly perfect complements. • If software becomes more expensive relative to computers, people are not likely to buy less software and use the savings to buy more computers.
ACTIVE LEARNING 6: Income & substitution effects • The two goods are skis and ski bindings. • Suppose the price of skis falls. Determine the effects on the consumer’s demand for both goods if • income effect > substitution effect • income effect < substitution effect • Which case do you think is more likely? 24
One Last Issue • Since an individual knows his or her own preferences better than anyone else, is cash the best gift for someone?