Download
1 / 47
470 likes | 593 Views
This document discusses the advancements in astronomical data analysis since the Second World War, highlighting the transition from optical observations to diverse electromagnetic spectrum detection methods. It details various available astronomical databases, including bibliographical and observational data from both ground-based and space-based sources. Key considerations when using these databases are outlined, along with a methodical approach for extracting scientific insights from archival data, illustrated with a worked-out example related to the universe's star formation history.

E N D
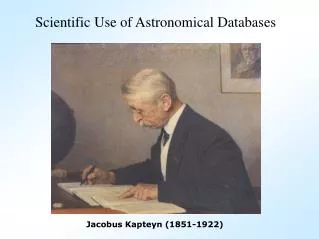
Scientific Use of Astronomical Databases Jacobus Kapteyn (1851-1922)
Contents: 1. The Electromagnetic Spectrum 2. Available Databases - Bibliographical - Observational (Ground based) - Observational (Space based) - Software 3. Caveats when using databases 4. How to get science out of archive data - A published paper - A worked-out example
1. The Electromagnetic Spectrum Until the Second World War Astronomy was an Optical Science: all observations were made with instruments working in the visible (with usually the eye as a detector). As a result of modern technology, this has changed enormously.
Infrared (IRAS) Visual (Lund) Gamma-Ray (CGRO) Radio (various places) X-Ray (HEAO-1)
X-ray UV Visual IR (IRAS) Radio (VLA)
X-ray Visible Radio IR (ISO)
Available Databases 1. Bibliographic Journals in Astronomy: all on NASA ADS (http://adswww.harvard.edu/index.html) This site has several mirrors across the world. Preprints:http://arXiv.org/ also with several mirrors Makes libraries redundant!
The NASA Astrophysical Data System http://adswww.harvard.edu
Searching the Database Select a Database: • Astronomy/Astrophysics abstracts • Instrumentation • Physics and Geophysics • ADS/astro-ph preprints
Creating the Query: • Title • Author • Object • Keyword
Information provided about links: O: Original Author Abstract E: Online E-Journal at site of publisher F: Full article available from ADS S: Link to SIMBAD N: Link to NED C: Citations
Available Databases: Observations Available at present: • Satellites (HST, Chandra, IUE, IRAS, etc.) see MAST (Multimission Archive) http://archive.stsci.edu • Ground-based telescopes - Survey Telescopes (2MASS, POSS, SDSS, etc.) - General Observer Telescopes (ESO, La Palma, UKIRT, CFHT/CADC, JCMT, VLA) • Object-oriented - Galaxies: NASA Extragalactic Database (NED); LEDA - Nearby Galaxies: Hypercat (specialised) - Stars: SIMBAD
References: The electromagnetic spectrum:http://www.ipac.caltech.edu/Outreach/Multiwave/ (at IPAC) Data Archives: Satellites: reachable through STScI (http://archive.stsci.edu/) ESO: http://archive.eso.org/ La Palma: http://archive.ast.cam.ac.uk/ingarch/ UKIRT: http://archive.ast.cam.ac.uk/ukirt_arch/ CFHT: at CADC (http://cadcwww.dao.nrc.ca/) together with a lot of Other archives VLA: http://www.aoc.nrao.edu/vla/vladb/ Etc. Object oriented: Simbad (stars): http://simbad.u-strasbg.fr/Simbad LEDA (nearby galaxies): http://leda.univ-lyon1.fr/ Hypercat (nearby galaxies): http://www-obs.univ-lyon1.fr/hypercat/
MAST Database similar to the HST archive with lots of space missions
SDSS Imaging and Spectroscopy Megasite
The Sloan Digital Sky Survey (Princeton, JHU, etc.) Dedicated survey of 8000 degree2 Imaging in ugriz Spectroscopy from 3800-9200 A Derivation of age from spectra Imaging Coverage Spectroscopic Coverage
The SDSS imaging camera
Dichroics The SDSS Spectrographs Plug-plates (640 fibers/plate)
200000 spectra from the SDSS survey Age Larger galaxies are older (Gallazzi et al. 2005)!
CADC Site comparable to the CDS with many archives and mirrors Has CFHT, JCMT, Gemini archives
NASA´s Extragalactic Database (NED) Database of literature parameters of extragalactic objects Similar to SIMBAD for Galactic objects
NED Gives: - Object names - Coordinates (different systems) - Classification - Basic RC3 and other Atlas parameters - References where this object is discussed - Photometric datapoints - Diameter datapoints - Image database - Several useful links
Has functionality of Alladin, but also includes images from individual papers.
Other Functionalities of NED: - Gives references where the object is used - Gives database of photometric datapoints
Other Functionalities of NED: Level 5 Database: Database of important articles
Very often used: • Data Reduction and Analysis: AIPS, ESO-MIDAS, IDL, IRAF, PROS, STARLINK, STSDAS • Document Preparation: LaTeX, TeX • Modelling: NEMO, CLOUDY, DUSTY, TINYTIM • Subroutine Libraries: FITSIO, NAG, Numerical Recipes, Python • Math Routines: Maple, StatCodes • Utilities: ...
3. Caveats when using databases - Documentation might be wrong or incomplete - Data quality varying (seeing, photometric conditions) - Varying depth in data (difficult to calculate statistically complete samples) - Instrumental settings might be varying without the user knowing this. - All this is worse for ground-based than for space-based archives.
4. How to produce science with databases Process: 1. Ask scientific questions 2. Find suitable scientific databases 3. Select sample using one database 4. Extract sample from image using a VO-tool to determine a catalog 5. Do the same for other bands 6. Cross-correlate catalogs with each other and with existing data Here is important that the extracted image sizes are the same (PSF matching!) 7. Do analysis on the common sample.
An example, the Star Formation History in the Universe (Cimatti, de Young) Scientific Questions: 1. When did the first objects form? 2. What are the progenitors of present-day giant ellipticals? 3. What types of galaxies are there at z> 1, 2, 4? 4. How many massive galaxies were already assembled at z=1,2,4? 5. How does the star formation and galaxy stellar mass density evolve? 6. What is the evolution of the metallicity in the Universe with redshift?
Data available for the GOODS survey - HST/ACS imaging in bviz - Ground-based imaging in UBVRIZJHK - Optical Spectroscopy (ESO-VLT etc.) - Radio data Merlin, GMRT, VLA, Atca - Chandra/XMM-Newton X-ray data - Spitzer MIR imaging (3.6, 4.5, ..., 24 micron) - GALEX UV imaging
Sample Selection: - Using deep red passband (e.g. K-band at 2.2 micron) Why? Young stars generally shine most of their light in the blue, while old stars are brighter in the red. Young stars generally have high L/M ratios (Luminosities for a given mass), so the mass of a galaxy is generally determined by the red stars. So: to find the mass, a red band is required. Redshift moves the light towards redder wavelengths: wavelength lobs = lrest (1+z). This means that observed R-band for z=4 corresponds to l=1200A ! So, need to go to very red bands.
2. Find the sources and extract their photometric parameters (e.g. Using SEXtractor) (or using WESIX http://nvogre.phyast.pitt.edu:8080/wesix/ ) 3. Do this also for other bands and cross-correlate the catalogs (see e.g. http://openskyquery.org) (Sites above are links from the US NVO (http://www.us-vo.org) 4. Determine redshifts - spectroscopic redshifts (from telescope, difficult) - photometric redshifts 5. Determine morphological information - concentration, asymmetry, clumpiness parameters (CAS) (Abraham et al., Conselice et al.) or surface brightness fits (GALFIT, GIM2D). This should be done on thumbnail images, preferably to be able to check and refine the results. 6. Compare with theoretical predictions (or simulations). If these are simulations, one could treat them the same as the observations.
Photometric Redshifts: Determining redshifts from photometric data Determine the most likely redshift of an object by fitting the spectral energy distribution to redshifted model spectral energy distributions of different types of astronomical objects, where galactic reddening is taken into account. Minimizing:
How does hyperz work? Hyperz uses the fact that a galaxy spectrum has distinct features, such as the Balmer jump. With redshift these features slowly shift into different passbands. Since the variety in galaxy spectra is limited, one can disentangle the effects of spectral shape and redshift.
Some template spectrum for typical galaxies From stellar library of Bruzual & Charlot (2003). Important: large wavelength coverage. - More passbands – more accurate photometric redshifts - Accuracies (when including K) often as good as Delta_z=0.02
The dropout method: find the reddest galaxies - by selecting the objects that are not detected in the bluest band (or bands) the reddest objects are found, which often are the objects at the highest redshift. By-products from using hyperz: - One obtains reddening, galaxy type and intrinsic luminosity - This can be converted into reddening, star formation rate and galaxy mass
Several galaxies are found at z=7. Very luminous galaxies are rare beyond redshift 7 (Bouwens & Illingworth 06) Using NICMOS and ACS: z-band dropouts (lz,eff=850 nm)
Result: the History of Star Formation in the Universe (Feulner et al. 2004)