Download
1 / 14
140 likes | 309 Views
Explore the global energy landscape, the problem of energy supply, and sustainable solutions for a brighter future. Learn about environmentally-friendly resources, projections, and the urgent need for change to ensure a sustainable energy cycle.

E N D
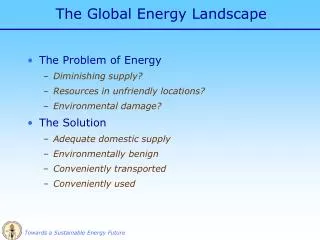
The Global Energy Landscape • The Problem of Energy • Diminishing supply? • Resources in unfriendly locations? • Environmental damage? • The Solution • Adequate domestic supply • Environmentally benign • Conveniently transported • Conveniently used
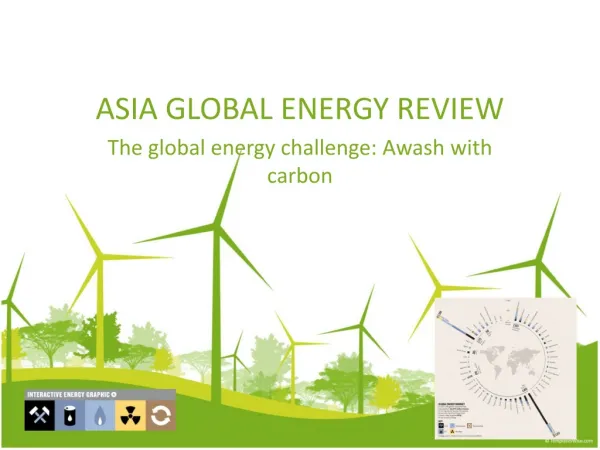
World Energy Consumption 260,000,000,000 60W bulbs continuously 2005 totals: 490 Q-Btu, 515 EJ, 16TW 2030 projections: 720 Q-Btu, 760 EJ, 24TW 86% fossil 81% Source: US Energy Information Administration
World Energy Consumption 264 8.4 211 6.7 158 5.0 Equivalent Power (TW, 1012) Exa Joules (1018) 106 3.3 52 1.7 0 0 How good is the EIA at making projections?? (annual) Source: US Energy Information Agency Coal, actual
Fossil Fuel Supplies 400 yrs Source: US Energy Information Administration Rsv = Reserves (90%) Rsc = Resources (50%) 56-77 287-345
Reserves History for American Coal Courtesy: David Rutledge Coal Commission (based on surveys by Marius Campbell of the USGS) 4,045 years Paul Averitt (USGS) 2,136 years 1,433 years Bureau of Mines/EIA (based on Paul Averitt’s surveys) 270 years 236 years 368 years “Hubbert Peak” type of analysis suggests 90% depletion by 2076
US Energy Imports/Exports: 1949-2004 1957: Net Importer Source: US Energy Information Administration Imports Exports 35 6 Total 30 5 25 4 Total 20 Quad BTU Coal 3 Quad BTU 15 2 10 Petroleum 1 5 Petroleum 0 0 1950 1960 1970 1980 1990 2000 1950 1960 1970 1980 1990 2000 • 65% of known petroleum reserves in Middle East • 3% of reserves in USA, but 25% of world consumption Net 35 30 25 20 Quad BTU 15 10 5 0 1950 1960 1970 1980 1990 2000
Environmental Outlook Global CO2 levels 2009: 385 ppm Projections: 500-700 ppm by 2020 • Anthropogenic • Fossil fuel (75%) • Land use (25%) Industrial Revolution Source: Oak Ridge National Laboratory
Environmental Outlook CO2 (ppmv) 325 300 275 CO2 in 2008: 385ppmv CH4 (ppmv) 250 800 -- CO2 -- CH4 --T 225 + 4 700 200 0 T relative to present (°C) 175 600 - 4 500 400 - 8 300 100 400 200 300 0 Thousands of years before present (Ky BP) Intergovernmental Panel on Climate Change, 2001; http://www.ipcc.ch N. Oreskes, Science 306, 1686, 2004; D. A. Stainforth et al, Nature 433, 403, 2005
Future Scenarios Centuries for CO2 to decay Courtesy: John Seinfeld Most optimitistic scenario
Future Scenarios Courtesy: John Seinfeld Highly optimitistic scenario: stabilize at 380 ppm (aerosols)
Supply Uncertainty in assessing High geopolitical risk Rising costs Environmental Impact Target, by 2050 Stabilize CO2 at 550 ppm Requires 20 TW carbon-free power One 1-GW power plant daily from now until then Energy Outlook Urgency • Transport of CO2 or heat into deep oceans: • 400-1000 years; CO2 build-up is cummulative • Must make dramatic changes within next few years
Solar 1.2 x 10⁵ TW at Earth surface 600 TW practical The Energy Solution Courtesy: Nate Lewis The need: ~ 20 TW by 2050 Wind 2-4 TW extractable Biomass 5-7 TW gross all cultivatable land not used for food Tide/Ocean Currents 2 TW gross Hydroelectric Geothermal 4.6 TW gross 1.6 TW technically feasible 0.9 TW economically feasible 0.6 TW installed capacity 12 TW gross over land small fraction recoverable Nuclear Waste disposal 60 yr uranium supply Fossil with sequestration 1% / yr leakage -> lost in 100 yrs
A Sustainable Energy Cycle C-free Source H2O, CO2 Solar power plant H2 Capture e- ??? Hydrides? Liquid H2? Batteries Storage Hydrocarbon Delivery e- Utilization H2O + CO2 Fuel cell
A Sustainable Energy Cycle C-free Source H2O, CO2 Solar power plant H2 Capture e- ??? Hydrides? Liquid H2? Batteries Storage Hydrocarbon Delivery e- Utilization H2O + CO2 Fuel cell