Download
1 / 53
530 likes | 608 Views
Analyzing American Evaluation Association membership through surveys, interviews, and feedback to enhance services. Includes findings, profiles, and desires of new and diverse members.

E N D
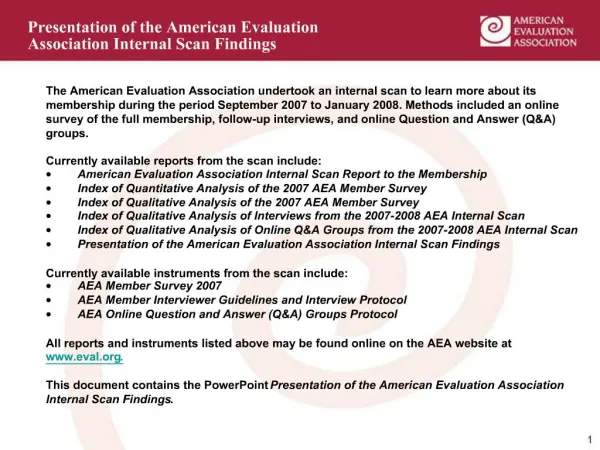
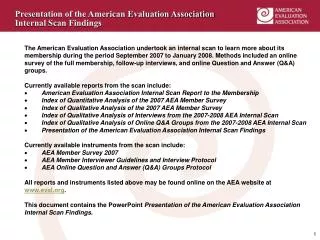
Presentation of the American Evaluation Association Internal Scan Findings The American Evaluation Association undertook an internal scan to learn more about its membership during the period September 2007 to January 2008. Methods included an online survey of the full membership, follow-up interviews, and online Question and Answer (Q&A) groups. Currently available reports from the scan include: ·American Evaluation Association Internal Scan Report to the Membership ·Index of Quantitative Analysis of the 2007 AEA Member Survey ·Index of Qualitative Analysis of the 2007 AEA Member Survey ·Index of Qualitative Analysis of Interviews from the 2007-2008 AEA Internal Scan ·Index of Qualitative Analysis of Online Q&A Groups from the 2007-2008 AEA Internal Scan ·Presentation of the American Evaluation Association Internal Scan Findings Currently available instruments from the scan include: ·AEA Member Survey 2007 ·AEA Member Interviewer Guidelines and Interview Protocol ·AEA Online Question and Answer (Q&A) Groups Protocol All reports and instruments listed above may be found online on the AEA website at www.eval.org. This document contains the PowerPoint Presentation of the American Evaluation Association Internal Scan Findings.
Presentation of the American Evaluation Association Internal Scan Findings Presented to The AEA Board By Goodman Research Group, Inc. February 29/March 1 2008
Three member inputs • Online survey • Interviews • Online discussion groups
Nonrespondent Satisfaction with AEA Products, Services, Benefits • 10% extremely satisfied • 58% very satisfied • 28% somewhat satisfied • 4% only a little satisfied
Who are our members? • 67% Female, 33% Male • 86% U.S., 14% International • 73% White • 52% Doctorate, 42% Master’s, 7% Bachelor’s • 21% New, 44% Short-term, 36% Long-term members
It’s Not Easy Bein’ Green New Members in AEA
Profile of New Members • Higher percentages of females, members of color, international members • Biggest percentage young and relatively inexperienced, but not all new members are new evaluators • More Master’s level
New Member Use of Current AEA Resources • Fewer have used resources; however: • Majority use AJE and NDE, website, Guiding Principles • Two in ten participate in TIGs • New and longer-term members find resources equally useful • New members find website more useful
New Member Desires • New members want same resources (but are more interested in them) • Highly desirable resources: • Online archive of evaluation materials (69% highly desirable) • New training opportunities live in region (62%) • New members also desire: • Journal targeted to practitioners (48%) • Updates on public policy issues (39%) • DVD-CD ROM of training materials (39%) • Web-based training (pre-recorded) (38%) • Professional mentoring (35%) • Hardcopy self-study texts (35%)
Voices of New Members • Forming professional identity in evaluation • Guidance upon entering evaluation • Mentoring along the way • Opportunities to get involved in AEA
Members of Color • Race/ethnicity data available from 89% (n=2,361) of respondents • 71% (n=1,874) White • 18% (n=487) Members of color (Black, Asian, Latino, American Indian, Pacific Islander, Biracial, Multiracial) • 11% (n=296) missing race/ethnicity data • 5% (n=135) identified as International • 3% (n=84) actively chose not to respond • 2% (n=40) identified as other • 1% (n=37) skipped question
Members of Color in U.S. • Among U.S. residents for whom race/ethnicity data are available: • 80% (n=1,707) White • 20% (n=428) Members of color
Demographic Profile of U.S. Members of Color • Younger • Less experienced • Newer members • No differences in gender, highest degree
Evaluation Profile of U.S. Members of Color • More likely than White members to be a student in evaluation • Less likely than White members to be conducting evaluations, teaching evaluation, training others in evaluation • One content area in which members of color more likely to be working than White members: Indigenous peoples
AEA Profile ofU.S. Members of Color • Members of color find AEA services/products more useful than do White members. • Members of color with more than 2 yrs experience in evaluation find publications, newsletter, website, TIGs more useful than do White members at the same experience level. • Higher percentage of members of color (with more than 2 yrs exp) have: • attended AEA/CDC Summer Institute (24%, compared to 17% White members). • accessed electronic newsletter (51% vs. 41%).
AEA Profile ofU.S. Members of Color (cont.) • Members of color express greater need for evaluation resources than do White members, • Members of color with more than 2 yrs experience in evaluation find all potential new products and services more desirable than do White members at the same experience level. • Professional mentoring ranks higher on the list of desirable resources for members of color (with more than 2 yrs exp). • No difference in strength of affiliation, number of other professional associations
Bridging Academic and Practitioner Concerns Faculty and Evaluators in AEA
Four Key Member Identities • 49% evaluator • 15% faculty • 14% researcher • 7% student
Faculty Evaluation Profile • Most faculty conduct evaluations • 92% conduct evaluations; 90% had conducted evaluations in the last year • But devote less time to evaluation-related work • Also, their evaluation-related work differs: • 74% teach evaluation • 39% work on evaluation methods • 23% work on evaluation theory
Differences in Strength of Affiliation • Evaluators most affiliated, researchers least affiliated • 54% evaluators affiliate most strongly with AEA • 44% students • 37% faculty • 29% researchers
Differences in Use of Products, Services • More of the faculty use journals, Guiding Principles (GP), newsletter, TIGs • 86% of brand new faculty had read AJE, compared to 64% of new evaluators • 60% of new faculty had read NDE, compared to 48% of new evaluators Note: Only 48 new faculty among survey respondents
Differences in Usefulness of Products, Services • Differences in AJE, NDE, GP, annual meeting, TIGs, EVALTALK • Faculty give find GP, AJE, NDE, TIGs highest usefulness ratings • Faculty and students rate annual meeting more useful • Students find EVALTALK most useful, faculty least useful
Employment by Professional Identity in Evaluation • 30% of members employed in universities • Of these: • 57% primary professional identity in evaluation is faculty • 31% primary professional identity is evaluator
Employment and Professional Identity by Length of Membership • Smaller percentage of new members employed in universities • Among more experienced members: • 41% of new members identify as faculty • 43% of shorter-term members • 52% of longer-term members
Faculty and Evaluator Responses to Existing and New AEA Resources • Faculty and evaluators find many current resources equally useful • Faculty find journals more useful than do evaluators • Faculty and evaluators have equal interest in a journal for practitioners
Some Practitioner Perceptions Theory Nuances Treatises Ivory tower
solutions constraints dilemmas issues common current practical real What Some Practitioners Want to See and Discuss
Members’ Many Hats • 84% do some non-evaluation work • 92% do more than conduct evaluations • 84% work in more than one content area • 23% U.S. members do some international work • 31% international members do U.S. work
A Simple Framework Members AEA Public Policy
AEA Members • 42% would find updates on public policy issues that affect evaluation highly desirable • 53% members of color vs. 38% White members • Evaluators in government, public policy find updates more desirable than evaluators in other settings
AEA Public Policy • Give input • Structure better conversations • Work with legislators • Take a stand • Advocate
Bringing AEA into the Everyday Gaining Greater Access to the Benefits of AEA
Highly Desired Resources • Online archive of evaluation material (65% highly desirable) • Live regional trainings (52%)
Challenges Related to Time • Lack of time (and money) to travel to conference, institute • Return on investment has to be worth it
Challenges Related to Access • Lack comprehensive set of references • Cannot access publications, literature • Want conference materials online • Overseas members need alternative to in-person