Download
1 / 1
10 likes | 139 Views
A two-mode range meter for nanometric accuracy ( & picometric resolution ) long distance measurements in space. D. H. Phung 1 , C. Courde 1 , A.Brillet 1 , C.Alexandre 2 , M. Lintz 1 ( michel.lintz@oca.eu ) ,

E N D
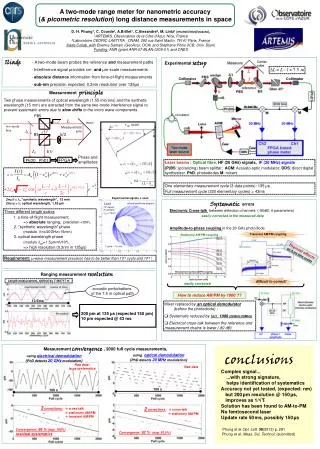
A two-mode range meter for nanometric accuracy (& picometric resolution) long distance measurements in space D. H. Phung1, C. Courde1, A.Brillet1, C.Alexandre2, M. Lintz1(michel.lintz@oca.eu), 1ARTEMIS, Observatoire de la Côte d'Azur, Nice, France 2Laboratoire CEDRIC-LAETITIA , CNAM, 292 rue Saint Martin, 75141 Paris, France Iliade Collab. with Etienne Samain (GéoAzur, OCA) and Stéphane Pitois (ICB, Univ. Dijon) Funding: ANR (grant ANR-07-BLAN-0309-01) and CNES - A two-mode beam probes the reference and measurement paths - Interference signal provides cm- and µm-scale measurements - absolute distance information from time-of-flight measurements - sub-nm precision expected. 0.3nm resolution over 135µs Iliade Experimental setup Collimator Collimator target two-mode beat Measurement arm Measurement principle Two phase measurements of optical wavelength (1.55 microns) and the synthetic wavelength (15 mm) are extracted from the same two-mode interference signal to prevent systematic errors due to slow drifts in the micro wave components. Phase and amplitudes FPGA L scan 104 dents! (F=20GHz, opt=1.5µm) Laser beams ; Optical fibre, HF (20 GHz) signals, IF (20 MHz) signals (P)BS: (polarizing) beam splitter; AOM: Acousto-optic modulator; DDS: direct digital synthesizer. PhD: photodiodes M: mixers One elementary measurement cycle (3 data points): 135 µs. Full measurement cycle (320 elementary cycles) = 43ms 2πc/ = , "synthetic wavelength", 15 mm 2πc/ = , optical wavelength, 1.55 µm Systematic errors vopt scan Electronic Cross-talk between detection channels (-60dB; 4 parameters) Three different length scales 1. a time-of-flight measurement, => absolute ranging, precision <mm, 2. "synthetic wavelength" phase (modulo Λ=c/20GHz=15mm) 3. optical wavelength phase (modulo λopt=1.5µm=Λ/104), => high resolution (0.3nm in 135µs) easily corrected in the measured data Amplitude-to-phase coupling in the 20 GHz photodiode Transient AM/PM coupling Stationary AM/PM coupling 4 Thermal effects µs & ms time scales Requirement:µ-wave measurement precision has to be better than 10-4 cycle and 10-4 ! Ranging measurement resolution 200 pm at 135 µs (expected 150 pm) 10 pm expected @ 43 ms Allan deviation of measurement noise Length measurement, shifted by 7.492717 m difficult to correct! easily corrected acoustic perturbations of the 7.5 m optical path How to reduce AM/PM by 1000 ?? 13.5ms • Mixer replaced by an optical demodulator (before the photodiode) : • Systematic reduced by fact. 1000 (20GHz/20MHz) • Electrical cross-talk between the reference and measurement chains is lower (-80 dB) Experimental signals, L scan and better than 10 pm at 43 ms. phase/amplitude diagram The resolution measurement is better than 200 pm at 135 µs. conclusions Complex signal... ...with strong signature, helps identification of systematics Accuracy not yet tested, (expected: nm) but 200pm resolution @ 150µs, improves as 1/ Solution has been found to AM-to-PM No femtosecond laser Update rate 50ms, possibly 150µs Phung et al Opt. Lett.38(2013) p. 281 Phung et al, Meas. Sci. Technol. (submitted) Measurement convergence, 2000 full cycle measurements, 1 cycle ~ 15 mm usingoptical demodulation (PhD detects 20 MHzmodulation) usingelectrical demodulation (PhD detects 20 GHz modulation) Raw data: large systematics Raw data 100 s 100 s 3 corrections: cross-talk stationary AM/PM transient AM/PM 2 corrections: cross-talk stationary AM/PM Convergence: 86 %(exp. 100%) residual systematics Convergence: 92 % (exp. 93.5%)