Download
1 / 14
140 likes | 159 Views
This study examines the impact of baking on the cryogenic system of the JT60-SA tokamak, including constraints, conditions, and associated cool-down. The goal is to achieve optimal plasma performance by conditioning plasma-facing surfaces through the efficient removal of impurities.

E N D
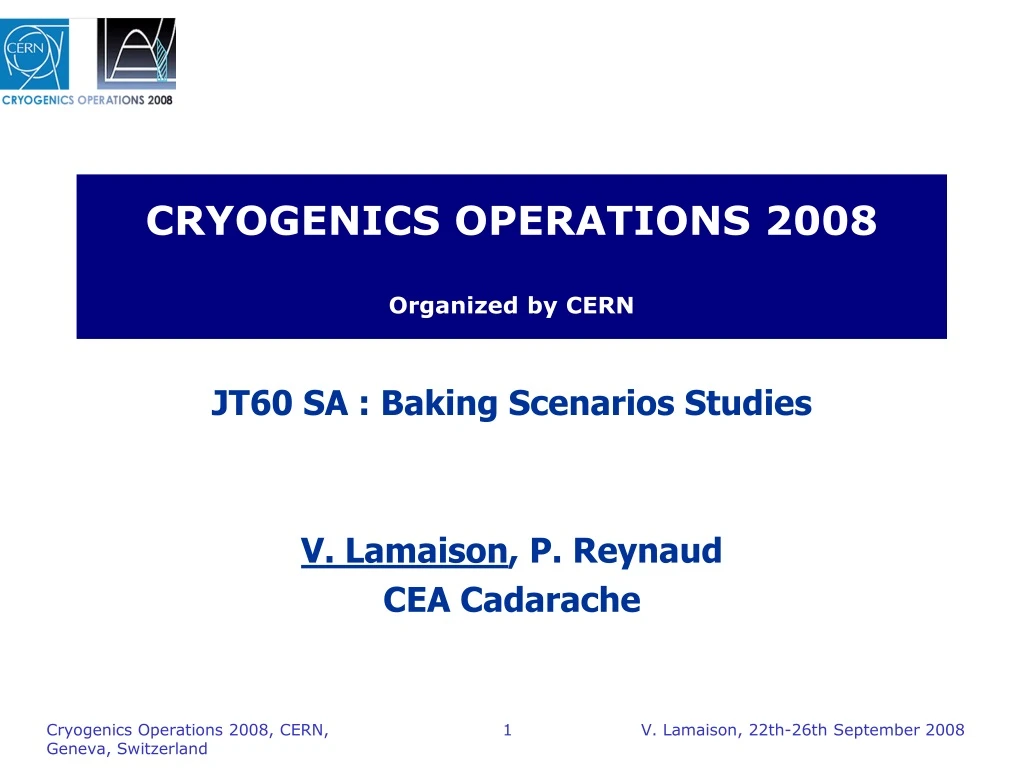
CRYOGENICS OPERATIONS 2008Organized by CERN JT60 SA : Baking Scenarios Studies V. Lamaison, P. Reynaud CEA Cadarache Cryogenics Operations 2008, CERN, Geneva, Switzerland
Outline • Baking for what ? • Impact on the cryogenic system • JT60 SA Baking • Baking conditions and constraints • Plasma Operation State • 3 scenarios : baking and associated cool down • Conclusion Cryogenics Operations 2008, CERN, Geneva, Switzerland
Baking for what ? Plasma facing surfaces conditioning is an aspect of plasma operation necessary to obtain very low impurity release conditions that are essential for tokamak plasma operation in general and high fusion performance operation Baking of the vacuum vessel is one of the techniques used Baking is efficient in removing water, volatile hydrocarbons and hydrogen Vacuum vessel temperature is led and maintained to around 200°C (473K) during several days Cryogenics Operations 2008, CERN, Geneva, Switzerland 3 V. Lamaison, 22th-26th September 2008
Impact on the cryogenic system 1/ 36 JT60 thermal shields Cryostat thermal shield • Radiation heat loads on thermal shields of vacuum vessel increase • Helium mass flow to maintain thermal shields at 80K increases • Baking can be sizing for the cryogenic system Vacuum vessel location 473°C Vacuum vessel thermal shield Cryogenics Operations 2008, CERN, Geneva, Switzerland 4 V. Lamaison, 22th-26th September 2008
JT60 SA Baking Baking constraints : baking must be a «non-sizing» operation state for the cryogenic system compared to the Plasma Operation State (POS) POS fixes maximum helium mass flow • Baking conditions : • Vacuum vessel temperature = 313 to 473K, heat speed =10K/h • Tinlet thermal shields = 80K • Toutlet thermal shields ≤ 140K • Magnets temperature ≤ 70K • 5 days of baking every 3 weeks • 3 scenarios : • baking phase • associated cool down phase Cryogenics Operations 2008, CERN, Geneva, Switzerland 5 V. Lamaison, 22th-26th September 2008
JT60 SA Plasma Operation State Heat loads at 4.3K = 6.23kW Helium loops through a thermal buffer He mass flow = 460g/s HTS current leads HeMass flow (50K-300K) = 24g/s Heat loads at 80K = 32kW (Radiation heat loads on thermal shields = 22.8kW) HeMass flow (80K-100K) = 300g/s Return to low pressure Return to middle pressure Cryogenics Operations 2008, CERN, Geneva, Switzerland 6 V. Lamaison, 22th-26th September 2008
JT60 SA Plasma Operation State • Scheme of the cryoplant LP MP HP 1098 g/s mass flow in turbines = 315g/s Helium refrigerator turbines LHe 300g/s 484g/s Thermal Buffer Current leads Thermal shields TF, EF, CS, cryopumps Cryogenics Operations 2008, CERN, Geneva, Switzerland 7 V. Lamaison, 22th-26th September 2008
Scenario 1 • Baking : thermal conditions • Vacuum vessel temperature = 313 to 473K, heat speed = 10K/h • Average temperature of thermal shields = 100K, Tinlet = 80K, Toutlet = 120K, heat speed = 1K/h Radiation heat loads on thermal shields = 117kW • Magnets temperature = 4.5K Helium loops through thermal buffer in operation Heat loads at 4.5K = 4.32kW Helium loops in operation Mass flow = 280g/s Heat loads at 80K = 124kW Radiation heat loads on TS = 117kW Mass flow = 602g/s 1st stage of compression = 280g/s 2nd stage of compression = 280+602+220 = 1102g/s Cryogenics Operations 2008, CERN, Geneva, Switzerland 8 V. Lamaison, 22th-26th September 2008
Scenario 1 • Cool down after 5 days of baking • Cool down speed of vacuum vessel = 10K/hfrom 473K to 313K • Cool down speed of thermal shields = 1K/h from 100K to 90K Temperature Mass flow Thermal conditions of POS mode are restored after 0.7 day of cool down Cryogenics Operations 2008, CERN, Geneva, Switzerland 9 V. Lamaison, 22th-26th September 2008
Scenario 2 • Baking : thermal conditions • Vacuum vessel temperature = 313 to 473K, heat speed = 10K/h • Average temperature of thermal shields = 105K, Tinlet = 80K, Toutlet = 130K, heat speed = 1K/h Radiation heat loads on thermal shields = 117kW • Magnets temperature = 4.5K Helium loops through thermal buffer in operation Heat loads at 4.5K = 4.57kW Helium loops in operation Mass flow = 292g/s Heat loads at 80K = 124kW Radiation heat loads on TS = 117kW Mass flow = 490g/s 1st stage of compression = 292g/s 2nd stage of compression = 292+490+220 = 1002g/s Cryogenics Operations 2008, CERN, Geneva, Switzerland 10 V. Lamaison, 22th-26th September 2008
Scenario 3 • Baking : thermal conditions • Vacuum vessel temperature = 313 to 473K, heat speed = 10K/h • Average temperature of thermal shields = 105K, Tinlet = 80K, Toutlet = 130K, heat speed = 1K/h Radiation heat loads on thermal shields = 117kW • Magnets temperature free Helium loops stopped Heat loads at 4.5K = 0kW Mass flow = 0g/s Heat loads at 80K = 124kW Radiation heat loads on TS = 117kW Mass flow = 490g/s 1st stage of compression stopped 2nd stage of compression = 490g/s Cryogenics Operations 2008, CERN, Geneva, Switzerland 11 V. Lamaison, 22th-26th September 2008
Scenario 3 Simulation • Baking • Vacuum vessel temperature increases from 313 to 473K with a heat speed = 10K/h • Warm-up speed of thermal shields = 1K/h from 90K to 105K • Cool down after 5 days of baking • Cool down speed of vacuum vessel = 10K/h • Cool down speed of thermal shields and TF coils = 1K/h • Cool down of TF coils is performed by helium flow at high pressure Cryogenics Operations 2008, CERN, Geneva, Switzerland 12 V. Lamaison, 22th-26th September 2008
Scenario 3 Temperature Mass flow • After 5 days of baking, TF coils reach 50K • Thermal conditions of POS mode are restored after 2 days of cool down Cryogenics Operations 2008, CERN, Geneva, Switzerland 13 V. Lamaison, 22th-26th September 2008
CONCLUSION • Comparison of the 3 scenarios • To compare the different scenarios, it is necessary to calculate theoretical electrical power for baking phase and associated cool down • Low pressure is fixed at 1bar, middle pressure at 5bars and high pressure at 18bars To combine electrical consumption and availability of the machine, the scenario 3 remains the most efficient. Cryogenics Operations 2008, CERN, Geneva, Switzerland 14 V. Lamaison, 22th-26th September 2008