Download

1 / 27
350 likes | 700 Views
Functions In Excel. A Function. Performs a predefined operation A function Accepts one or more arguments as input Performs the indicated calculation Returns another value as output. Main Functions. Financial Functions Statistical Functions DATABASE Functions. Financial Functions.

E N D
A Function • Performs a predefined operation • A function • Accepts one or more arguments as input • Performs the indicated calculation • Returns another value as output
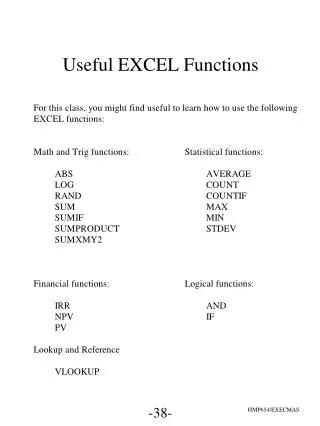
Main Functions • Financial Functions • Statistical Functions • DATABASE Functions
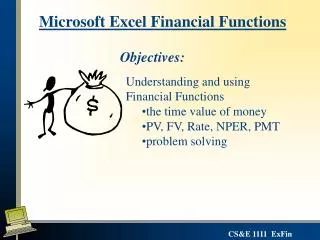
Financial Functions • NPV • IRR • PMT • IPMT • Be consistent about the units for specifying rate and nper • Monthly payments on a four-year loan at 12 percent annual interest, use 12%/12 for rate and 4*12 for nper. • Annual payments on the same loan, use 12% for rate and 4 for nper
PMT and IPMT • PMT- This function calculates the payment for a loan based on constant payments and constant interest rate • IPMT- This function calculates the interest payment based on periodic , constant payments and a constant interest rate
NPV • NPV(rate,value1,value2,…) • Rate is the rate of discount over the length of one period • Value1,value2,… must be equally spaced in time and occur at the end of each period
IRR • IRR(values,guess) • Values are an array or a reference to cells that contains numbers for which you want to calculate the internal rate of return • Guess is a number that you guess is close to the result of IRR
PMT • PMT(rate,nper,pv,fv,type) • Rate is the interest rte of the loan • Nper is the total number of payments for the loan • Pv is the present value • Fv is the future value • Type is the number 0 or 1 and indicates when payments are due
IPMT • IPMT(rate,per,nper,pv,fv,type) • Rate is the interest rate per period • Per is the period for which you want to find the interest and must be in the range 1 to nper • Nper is the total number of payment periods in an annuity • Pv is the present value • Fv is the future value • Type is the number 0 or 1 and indicates when payments are due
Statistical Functions in Excel
Statistical functions Excel has a wide variety of built-in statistics functions that give, the standard and mean deviation of a data sample, and the mean, median and mode of a set of values.
1. Average Function Returns the average (arithmetic mean) of the arguments. Syntax ::: AVERAGE(number1,number2,...) Number1, number2, ... are 1 to N numeric arguments for which you want the average. Example ::: Data = 10,7,9,27,2 AVERAGE(A2:A6) Average of the numbers above (11) AVERAGE(A2:A6, 5) Average of the numbers above and 5 (10)
2 . Median Function Returns the median of the given numbers. The median is the number in the middle of a set of numbers; that is, half the numbers have values that are greater than the median, and half have values that are less. Syntax::: MEDIAN(number1,number2,...) Number1, number2, ... are 1 to N numeric arguments for which you want the median. Example::: Data = 1,2,3,4,5,6 MEDIAN(A2:A6) Median of the first 5 numbers in the list above (3) MEDIAN(A2:A7) Median of all the numbers above, or the average of 3 and 4 (3.5)
3. AVEDEV Function Returns the average of the absolute deviations of data points from their mean. AVEDEV is a measure of the variability in a dataset. Syntax::: AVEDEV(number1,number2,...) Number1, number2, ... are 1 to 30 arguments for which you want the average of the absolute deviations. You can also use a single array or a reference to an array instead of arguments separated by commas. The equation : Example::: Data = 4,5,6,7,5,4,3 AVEDEV(A2:A8) Average of the absolute deviations of the numbers above from their mean (1.020408)
4 . STEDEV Function Estimates standard deviation based on a sample. The standard deviation is a measure of how widely values are dispersed from the standard value. Syntax::: STDEV(number1,number2,...) Number1, number2, ... are 1 to 30 number arguments corresponding to a sample of a population. You can also use a single array or a reference to an array instead of arguments separated by commas. The equation:
5. CORREL Function Returns the correlation coefficient of the array1 and array2 cell ranges. Use the correlation coefficient to determine the relationship between two properties. For example, you can examine the relationship between a location's average temperature and the use of air conditioners. Syntax ::: CORREL(array1,array2) Array1 is a cell range of values. Array2 is a second cell range of values. The equation :
6. RANK Function Returns the rank of a number in a list of numbers. The rank of a number is its size relative to other values in a list. (If you were to sort the list, the rank of the number would be its position.) Syntax::: RANK(number,ref,order) Number is the number whose rank you want to find. Ref is an array of, or a reference to, a list of numbers. Nonnumeric values in ref are ignored. Order is a number specifying how to rank number. • If order is 0 (zero) or omitted, Microsoft Excel ranks number as if ref were a list sorted in descending order. • If order is any nonzero value, Microsoft Excel ranks number as if ref were a list sorted in ascending order
Database Functions in Excel
Introduction • In this information age, the major challenge for every organization is to keep proper database in order to prosper in the future. • Databases are store-houses of information. • Provides latest information. • Database is an organized collection of related information about a particular subject or purpose. • Information in database is stored in rows and columns • Ms-Excel also contains a good database which is a collection ofinformationthat is organized so that it can easily be accessed, managed, and updated
Computer D a t a Hierarchy pyramid Traditional databases are organized by fields, records, and files. A field is a single piece of information; a record is one complete set of fields; and a file is a collection of records.
To access information from a database, you need a database management system (DBMS). This is a collection of programs that enables you to enter, organize, and select data in a database. The following figure shows the basic layout of a database table:
1. DAVERAGE Function Averages the values in a column of a list or database that match conditions you specify. Syntax::: DAVERAGE (database,field,criteria) • Database is the range of cells that makes up the list or database. • Field indicates which column is used in the function. Field can be given as text with the column label enclosed between double quotation marks, such as “-----” as a number that represents the position of the column within the list • Criteria is the range of cells that contains the conditions you specify
2. DSUM Function Adds the numbers in a column of a list or database that match conditions you specify. Syntax::: DSUM (database,field,criteria) • Database is the range of cells that makes up the list or database. • Field indicates which column is used in the function. Field can be given as text with the column label enclosed between double quotation marks, such as ”------” or as a number that represents the position of the column within the list • Criteria is the range of cells that contains the conditions you specify
3. DMAX Function Returns the largest number in a column of a list or database that matches conditions you specify. Syntax::: DMAX(database,field,criteria) • Database is the range of cells that makes up the list or database. • Field indicates which column is used in the function. Field can be given as text with the column label enclosed between double quotation marks, such as “-----” or as a number that represents the position of the column within the list • Criteria is the range of cells that contains the conditions you specify
4. DMIN Function Returns the largest number in a column of a list or database that matches conditions you specify. Syntax::: DMIN(database,field,criteria) • Database is the range of cells that makes up the list or database. • Field indicates which column is used in the function. Field can be given as text with the column label enclosed between double quotation marks, such as “-----” or as a number that represents the position of the column within the list • Criteria is the range of cells that contains the conditions you specify