Download

1 / 58
590 likes | 739 Views
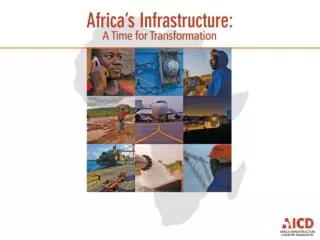
Zambia’s Infrastructure: A Continental Perspective. Africa Infrastructure Country Diagnostic: a multi-stakeholder effort. Methodology and approach. Methodology Data collection by local/international consultants and Bank staff based on standardized methodology

E N D
Africa Infrastructure Country Diagnostic: a multi-stakeholder effort
Methodology and approach • Methodology • Data collection by local/international consultants and Bank staff based on standardized methodology • Baseline year for data is 2006, does not reflect subsequent evolution • Approach • Focus on benchmarking Zambia’s infrastructure against African neighbors • Benchmarking group includes Resource Rich Countries (RR), Middle Income Countries (MIC), South African neighbors, and regional outliers
Despite Zambia’s strong economic growth, infrastructure’s contribution has been relatively low Changes in growth per capita due to changes in infrastructure (2001-5 vs. 1991-5)
Raising Zambia’s infrastructure to level of African leader could add 2.2 points to per capita growth rate Potential changes in growth per capita from improving infrastructure to level of African regional leader (Mauritius)
Key Message #1 Infrastructure has the potential to contribute more to Zambia’s infrastructure than it has in the past
Benchmarking highlights exceptionally low power tariffs and levels of electrification
Zambia’s power prices are the lowest in Africa, and also look low by global standards Power tariffs in other developing countries: upper bound Power tariffs in other developing countries: lower bound
Zambia’s power tariffs appear in line with operating costs but far from long-run capital costs
Hidden costs of power utilities are high due to underpricing
Access to power highly inequitable making any subsidies to sector highly regressive
No affordability problems for those with access, nor even many of those without
Key Message #2 Meeting future power demands and raising electrification will be difficult without higher power tariffs
Road network traffic concentrated between Lusaka and Copper belt
Main trunk network in good condition except in outlying areas
Benchmarking indicates possible over-engineering of paved network in contrast to poor unpaved network
Zambia has secured resources to cover road maintenance and rehabilitation needs of main road network
Levels of road sector spending are high in absolute terms and relative to GDP
Key Message #3 Strong budget envelope and apparent over-engineering of main roads suggests potential to shift resources to under-served rural roads
Zambia’s rail sector is a critical input for a minerals based economy
Benchmarking indicates low traffic density and relatively poor performance in terms of efficiency
Railway institutional reform scores relatively low indicating need to further develop supervision
Key Message #4 Improving supervisory framework could help to boost performance of rail concession
Concentrated potential for large scale irrigation with modest returns Simulated location of potential LARGE scale irrigation schemes
Scattered potential for small scale irrigation with higher returns Simulated location of potential SMALL scale irrigation schemes
Benchmarking indicates tendency to focus on higher end solutions and poor utility performance (*) Average of 3 providers
Dramatic urban – rural gaps and apparent declining coverage of piped water with increases elsewhere
Strong expansion of wells and boreholes, but worrisome increase in use of surface water
Expansion of sanitation options below the SSA average and troublesome expansion of open defecation
Hidden costs of Zambia’s water utilities are the highest in the region As of 2005
Key Message #5 Greater attention to sanitation and rural services needed, opportunity to harness new resources by improving efficiency
Zambia’s ICT network very tightly clustered around economic centers
Benchmarking indicates relatively low GSM coverage and relatively high price of calls Source: Preliminary results AICD 2008
High international call charges driven both by technology and market power
Some potential for private expansion of GSM coverage and only minimal need for subsidy
Key Message #6 Further competition across the board is needed to drive down prices and expand access
Spending needs 100% 80% Fundinggap 60% Efficiencygap 40% Existing spending 20% 0% Increasing cost recovery Improving operational efficiency $7.5 Prioritizing publicspending $3.3 Spendingbudgeted resources $1.9 All figures in US$ billion a year
Key Message #7 Zambia needs to spend around US$16 billion over the next decade to catch-up with the rest of the developing world
Illustrative infrastructure targets over next ten years
To meet these targets, Zambia would need to spend US$1,609 million a year for the next decade Trade expansion: 472
Burden of financing needs is substantial for Zambia at 15 percent of GDP
Key Message #8 Zambia already spends US$0.7 billion a year on infrastructure
Zambia’s spending mainly domestically financed though with significant contributions of ODA, PPI (*) Includes household self-financed investments in sanitation
Existing infrastructure spending in addressing needs is moderate at 6 percent of GDP
Key Message #9 Zambia faces an ‘efficiency gap’ worth US$0.3 billion a year