1 / 3

Abb. 1: Verlauf der Stickstoffaufnahme der Kartoffel

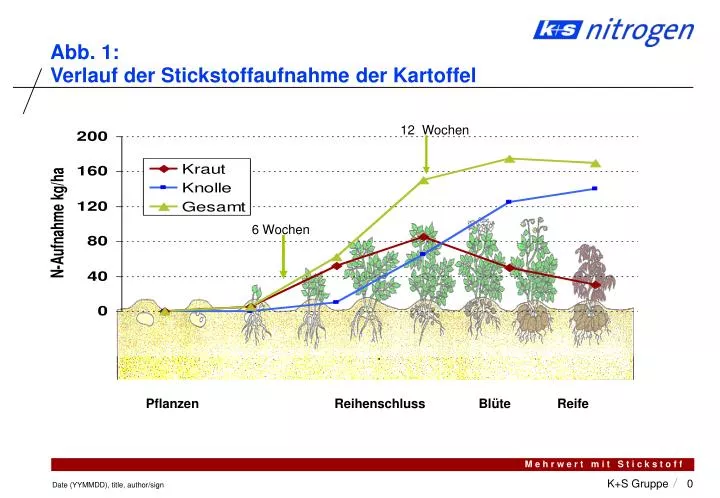
12 Wochen. 6 Wochen. Abb. 1: Verlauf der Stickstoffaufnahme der Kartoffel. Pflanzen Reihenschluss Blüte Reife. pH-Wert. 5,3 5,6 5,9 6,2 6,5 6,6 6,8 7,0 7,4 8,0. Nitrat-Ernährung. Ammonium-Ernährung.

Download Presentation

Abb. 1: Verlauf der Stickstoffaufnahme der Kartoffel

An Image/Link below is provided (as is) to download presentation Download Policy: Content on the Website is provided to you AS IS for your information and personal use and may not be sold / licensed / shared on other websites without getting consent from its author. Content is provided to you AS IS for your information and personal use only. Download presentation by click this link. While downloading, if for some reason you are not able to download a presentation, the publisher may have deleted the file from their server. During download, if you can't get a presentation, the file might be deleted by the publisher.

E N D

Presentation Transcript


  1. 12 Wochen 6 Wochen Abb. 1: Verlauf der Stickstoffaufnahme der Kartoffel Pflanzen Reihenschluss Blüte Reife

  2. pH-Wert 5,3 5,6 5,9 6,2 6,5 6,6 6,8 7,0 7,4 8,0 Nitrat-Ernährung Ammonium-Ernährung pH-Wert Erhöhung pH-Wert Senkung Quelle: Römheld, Inst. F. Pflanzenernährung Hohenheim Abb. 2: Ammonium oder Nitrat:Einfluss der N-Formen auf die Wurzeltätigkeit

  3. Abb. 3: Einfluss des pH-Wertes auf die Pflanzenverfügbarkeit Spurennährstoffe Molybdän Bor Kupfer Mangan Zink

More Related