Download
1 / 36
370 likes | 589 Views
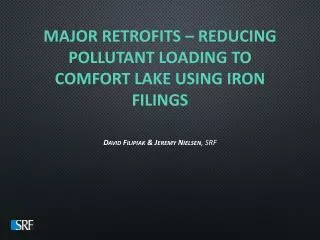
US Army Corps of Engineers. Research and Development. Using PLOAD to Estimate Pollutant Loading into Wetlands. by Jeff P. Lin and Barbara A. Kleiss. Tutorial Introduction.

E N D
US Army Corps of Engineers Research and Development Using PLOAD to Estimate Pollutant Loading into Wetlands by Jeff P. Lin and Barbara A. Kleiss
Tutorial Introduction The purpose of this tutorial is to introduce the user to the PLOAD software, and demonstrate how to apply it in measuring pollutant loads into wetlands. The tutorial is meant as a supplement, not a replacement, for the existing PLOAD user’s manual, and as such, does not cover basic operation of PLOAD software. There are several reasons that measuring pollutant loading into wetlands might be of interest and concern to those involved with wetland management and regulation. For example, urban development around a wetland is likely to increase pollutant loads into that wetland. Because heavy pollutant loads may adversely affect wetland functions, estimating the increase in pollutant load due to the development may be of interest for regulatory purposes. Also, many wetlands can improve water quality by removing pollutants from runoff before they reach a receiving water body. Measuring the potential pollutant load into a wetland can be useful for management purposes by helping planners decide where to create or restore wetlands so that they will provide the most water quality benefit.
Tutorial Introduction PLOAD requires ArcView® 3.x GIS software to run. Operational knowledge of ArcView® 3.x is not necessary in order to run PLOAD. However, some of the geographic coverages used in PLOAD may need to be pre-processed in ArcView before being input to the program. This tutorial contains optional sections on performing some of this processing, for those unfamiliar with using ArcView®. The files used in these sections can be downloaded at http://el.erdc.usace.army.mil/wrap/tools.html Many slides will have the icon in the upper right corner. Clicking on this icon will bring you back to the ‘Tutorial Sections’ page. The tutorial also contains many hyperlinks that will take you to other sections of the tutorial. Hyperlinks appear as underlined blue font words, like this. Questions or comments on the tutorial can be addressed to: Jeff.P.Lin@erdc.usace.army.mil
Tutorial Sections Section 1: Introduction to PLOAD Section 2: PLOAD Data Requirements Section 3: Identifying Applicable Wetlands Section 4: Running PLOAD Section 5: Choosing a Calculation Method Section 6: Incorporating BMPs Section 7: Incorporating Land Use Changes Section 8: Sources for Obtaining Data
Section 1: Introduction to PLOAD • Calculates pollutant loads for watersheds/basins. • A simple, screening-level GIS-based model. • PLOAD is an extension of EPA’s BASINS water quality software, available at this website: http://www.epa.gov/docs/ostwater/BASINS/ • PLOAD and BASINS are free, public domain software.
Section 1: Introduction to PLOAD What can PLOAD be used for? • Estimating pollutant loads into a wetland from point and non-point sources. • Estimating changes in pollutant load after incorporation of BMPs. • Estimating changes in pollutant load due to changes in land use. • Generating map outputs of pollutant loads by basin.
Section 2: PLOAD Data Requirements PLOAD calculates pollutant loads using one of two methods: • The “Simple” Calculation Method (Detailed in Section 4) 2. The “Export Coefficient” Method (Detailed in Section 5) Different data sets input by the user are needed for each of these methods.
Section 2: PLOAD Data Requirements Required for Both Calculation Methods • Watershed/Basin boundaries • Watershed/Basin land use coverage Required for “Simple” Calculation Method • Annual precipitation data for the area • Event Mean Concentration (EMC) table for pollutant(s) of interest • Land use imperviousness table Required for “Export Coefficient” Calculation Method • Export Coefficient table Optional Data for Both Calculation Methods • BMP efficiency table • Point source pollutant data table
Section 2: PLOAD Data Requirements Land Use Coverage PLOAD requires that the user input a land use ArcView shapefile. The landuse file must cover the entire area of the basin(s) being examined. The land use coverage should also have a corresponding database (.dbf) file, which must contain the following columns: 1. A polygon ID column 2. A land use ID column ArcView .dbf file
Section 2: PLOAD Data Requirements EMC and Export Coefficient Tables Depending on the calculation method selected, PLOAD requires a user-provided EMC or Export Coefficient Table, in the form of a Microsoft Excel (.xls) file or a database (.dbf) file. Both tables must consist of a minimum of two columns: 1. A land use ID column 2. A pollutant column This is a sample export coefficient table. Codes used in the land use ID column must correspond to those used in the landuse coverage .dbf file. This sample table has two columns for pollutants, one for total phosphorus (TP) and one for total nitrogen (TN). The numbers in those two columns represent the annual loading rate of those systems, in lbs/acre. Any other pollutant of interest with a known export coefficient can be added as an additional column(s). EMC tables are identical in form to export coefficient tables, except numbers in the pollutant columns are in mg/L.
Section 2: PLOAD Data Requirements Imperviousness Factor Tables The “simple” calculation method requires that the user input a surface imperviousness factor table. The imperviousness factor table must consist of a minimum of two columns: 1. A Land Use ID column 2. An imperviousness factor column This is a sample imperviousness factor table. Codes used in the land use ID column must correspond to those used in the land use coverage .dbf file. The numbers in the imperviousness factor column represent the percent imperviousness (0-100) associated with each landuse. Hence, higher numbers in this column equate to a larger amount of water surface runoff for the particular landuse.
Section 2: PLOAD Data Requirements BMP Tables With both calculation methods, the user has the option of incorporating the effects of Best Management Practices (BMPs). Doing so requires that the user input a BMP table, as well as a BMP shapefile. The BMP table must consist of a minimum of two columns: 1. A BMP ID column 2. A pollutant column This is a sample BMP table. It has two columns for pollutants. The pollutant column titles must correspond with those used in the export coefficient or EMC table. The numbers in the pollutant columns represent the BMP efficiency rate (percent), so in this example the 50-ft buffer will remove 70 percent TP and 30 percent TN. Additional BMPs can be added as extra rows in the table.
Section 2: PLOAD Data Requirements Point Source Pollutant Tables With both calculation methods, the user has the option of incorporating point source pollutant loading. Doing so requires that the user input a point source table, as well as a point source shapefile. The point source table must consist of a minimum of two columns: 1. A point source ID column 2. A pollutant column This is a sample point source table. It has two columns for pollutants (BOD and TSS), coming from one point source. Additional point sources can be added as extra rows in the table.
Section 3: Identifying Applicable Wetlands PLOAD can be applied to any wetland with a defined catchment. The wetland is the lowest elevation in the catchment. Therefore any rainfall within the catchment will run off into the wetland.
Section 3: Identifying Applicable Wetlands Drawing a Catchment: If the catchment for the wetland of interest is not already defined users will need to generate their own. Drawing the catchment will require some form of elevation data. Accuracy of the catchment will depend on the precision of the available elevation data. Digital 2-ft contour lines work well in most areas, although higher resolution could be needed in areas with very little relief (e.g. floodplains). However, contour data at that detail may not be readily available for all areas. Another alternative is to use USGS 1:24k topographic maps. These can be obtained through this website: http://topomaps.usgs.gov These maps generally contain 5-ft to 10-ft contour lines, and thus may not be as accurate for drawing catchments in flatter regions of the country. Also, if available, data from a field survey using standard surveying or GPS equipment may be used to determine elevations.
Section 3: Identifying Applicable Wetlands Catchment drawn using digital 2-ft contour lines
Section 3: Identifying Applicable Wetlands Catchment drawn using USGS 1:24k topographic map
Section 4: Running PLOAD Shown below is the main PLOAD session screen. From this screen the user can create a new session, input the wetland basins to be analyzed and the appropriate land use data set, select the calculation method to be used, and choose whether or not to use BMPs or point source pollutants in the analysis.
Section 4: Running PLOAD PLOAD assumes that the spatial units of the basin(s) and land use shapefile inputs are in meters. If the original input files have different spatial units (feet, for example), they will need to be re-projected into meters. For those unfamiliar with ArcView®, a mini-tutorial on re-projecting shapefiles can be accessed by clicking here.
Section 4: Running PLOAD The final option on the main PLOAD session screen is whether or not to use a pre-existing intersect/identity data set. In order to perform its analysis, PLOAD intersects the basin boundaries input by the user with the landuse file that has been input. This option allows users to input an intersected data set that they have generated on their own, rather than letting PLOAD run the intersection. ALWAYS SELECT ‘YES’ AT THIS SECTION.Due to a potential program ‘bug’ PLOAD will not generate loading output for small basins if you select “No” and let the program intersect the data. It is unclear exactly how small the basins need to be before this bug manifests itself, but most catchments for individual wetlands are probably small enough for this problem to occur. Therefore, users should always pre-intersect the land use and basin shapefiles in ArcView, and use that intersected file as the input in this step. For those unfamiliar with using ArcView, a mini-tutorial on intersecting shapefiles can be accessed by clicking here.
Section 5: Choosing a Calculation Method PLOAD will calculate pollutant loads based on one of two user-selected methods: the “simple” calculation method or the “export coefficient” calculation method. Selecting a method will largely depend on the land use composition and size of the wetland basin(s) being studied, as well as data availability for the area. The next two slides summarize the utility of each of these methods. The actual mathematical formulas used in these methods are detailed in the PLOAD user’s manual.
Section 5: Choosing a Calculation Method The “Simple” Calculation Method • This method is applicable only for drainage areas of less than 1 square mile. • The “simple” method requires event mean concentration (EMC) data. Because EMC data are generally available for urban land use types, this method is best suited for wetlands located in urban environments. PLOAD “simple” calculation input screen
Section 5: Choosing a Calculation Method The “Export Coefficient” Calculation Method In most situations, the “export coefficient” method will be the preferred way to calculate pollutant loads into the wetland. Using this method requires export coefficients. This method works for areas containing mixed land use, and the drainage area can be of any size. This method also requires fewer data inputs than the “simple” calculation method. PLOAD “Export Coefficient” calculation input screen
Section 6: Incorporating BMPs To the right is a graphical example of how BMPs can be incorporated into any analysis. In this case, a wetland is contained in small catchment consisting largely of farmland, with smaller urban and forested areas. Prior to implementation of any BMP, PLOAD calculates an estimated TN loading into the wetland of 4.24 lbs/acre/yr from the catchment. After implementing a 50-ft vegetative buffer (with an assumed BMP TN efficiency of 70 percent1) around the wetland, TN loading has decreased to 2.97 lbs/acre/yr. 1BMP Efficiency rate obtained from CH2MHILL Technical Memorandum No. 8. Watershed Modeling. http://projects.ch2m.com/WakeCounty/Docs/TM8_model%20assumptions.pdf +50 ft buffer BMP
Section 6: Incorporating BMPs Incorporating BMPs into PLOAD requires two files: a BMP shapefile and a BMP table. Although the BMP shapefile can be either a point or polygon coverage, the author has encountered problems in using point coverages and therefore recommends polygon coverages. The BMP shapefile input is the area served by the BMP. In the example in the previous slide, the 50-ft buffer BMP is reducing runoff to the wetland from the entire catchment. In order to simulate this effect, the inputted BMP shapefile is the same size and shape as the catchment itself. The BMP type names in the associated .dbf file must be identical to those used in the BMP table. BMP shapefile used in example on previous slide, with associated .dbf file.
Section 7: Incorporating Land Use Changes PLOAD can also address the effect of changes in landuse on pollutant loading into the wetland. In order to perform this analysis, the user must first incorporate the changes into the land use shapefile input to PLOAD. This can be done by using the polygon edit feature in ArcView®. For those unfamiliar with running ArcView, a mini tutorial can be accessed by clicking here. To analyze changes in pollutant loading due to altered landuse, PLOAD must be run twice; once with the original landuse input file, and then again with the new landuse file. The outputs from the two iterations can then be compared to evaluate changes in pollutant loading. The next slide shows an example of PLOAD used to measure changes in TP loading due to urban development in an agricultural area.
Section 7: Incorporating Land Use Changes Area shaded in black to be changed from agriculture to urban
Section 8: Sources for Obtaining Data EMC and Export Coefficient Data: The back of the PLOAD user’s manual provides EMC and export coefficient data and references for several areas of the country, although this is a far from being a comprehensive list. A technical note by Lin (available at xxx) provides additional sources for EMC and export coefficient values, as well as guidance on how to select appropriate numbers. Land Use Files Many states maintain their own web-based GIS data clearinghouses. These websites are usually a good source for obtaining local and regional land use coverages. The following website: http://libraries.mit.edu/gis/data/statecenter.html contains links to many of these state GIS websites.