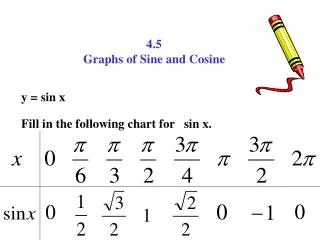
4.5 Using Graphs to Estimate Values
4.5 Using Graphs to Estimate Values. The following table shows how the volume of water used is related to the population for a city. Graph the following data and use your graph to: Estimate the monthly water usage for a population of 150 000 people.

4.5 Using Graphs to Estimate Values
E N D
Presentation Transcript
The following table shows how the volume of water used is related to the population for a city. • Graph the following data and use your graph to: • Estimate the monthly water usage for a population of 150 000 people. • Estimate the population when the monthly water usage is 1400 ML. • Predict the water usage for 250 000 people.
Interpolate: to estimate a value that lies between 2 data points on a graph. Extrapolate: to predict or infer an unknown value from known values (to go outside the data). • Example: Maya jogs on a running track. The graph shows how far she jogs in 10 minutes. • How far did she run in 3 minutes? • How long did it take her to run 600 m? • Predict how long it will take Maya to jog 2000 m. • Predict how far Maya will run in 14 minutes. • Which questions are examples of interpolation and which are examples of extrapolation? • What assumptions did you make?
Example: Use the graph to answer the following. • Determine the value of x when y = 3. • Determine the value of y when x = 5.
Line of Best Fit Very often data will be linear but not perfectly so. In cases like this we need to draw a line of best fit (LOBF) through the data and use that line to solve problems. When we draw a LOBF we need to graph the data and then draw the line through as many points as possible. Of the points that are not on the line, there should be about as many points above the line as below.
Example: The following data shows the weekly DVD rentals for a particular store. Graph the following data and use it to estimate the number of rentals in the 15th week.
Assignment Page 196 – 198 Questions 5, 7, 8 - 13