
Original Sequence
E N D
Presentation Transcript
Original Sequence • ANNNNNNNNNNCNNNCGGNGGCGGCCGCTCTAGAACTAGTGGATCCCCCGGGCTGCAGG{AATTCGGCACGAGCACACCTCTTCTTCTCCAGTTTTCTCGCGTTCTTATCAAGCTAAGCAGATCAGATTTCCATCATGGCTTTGAAGGAGGAATTTGAAGCGCACGCTGAGAAAGCTAAGACATTGCCCGAGAGTACCACCAATGAGAACAAGCTTATTCTTTACGGACTTTACAAGCAAGCCACCGTTGGCAATGTCAACACAAGCCATCCTGGCATATTCAACATGAGAGACAGAGCAAAGTGGGATGCATGGAAGGCTGTTGAAGGAAAATCCACCGATGAAGCCATGAACGACTACATCACCAAGGTGAAACAGTTGCTGGAAGAAGGTGCTGCTTCAGCATAAGGCTCATCTATCTATCTTGTTAAATTGTTATTGGAATTGGACTATGTGGCTTGTTTGATTTTAGTGTAACAGCAGGTGTACGTTTTTCCTGGCTAGG}AAAAAAAATTTACTGCTATAAGTATGTCTGAACCTTCTATCAATAAACCCCTAAAAAAGTTTGAATTTGGTTTCTTTAAAAAAAAAAAAAAAAAAAAAAAAAAAANCNNGGGGGGGNGNNNGGCCCCCATTNCCCCCNANNNNGNGGNNAATANAAN • Cropped region: 483bp
Nucleotide BLAST est Results Since the E-value is 0.0 this sequence must have involvement with cold sweetening B in solanumtuberosum
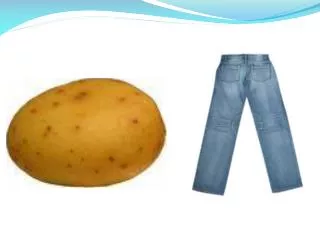
What is Cold Sweetening B? • the cold sweetening B gene is involved with the adaptive advantage of regulating the amount of sugars (sucrose, glucose, and fructose) that are put into storage organ tissues during periods of cold temperature. • Higher or lower than normal temperatures exert stress on plants and induce changes in cellular metabolism
What does this mean? • The gene expression levels must therefore change depending on temperature. • Could we test to see if this is true?
A similar experiment made an attempt • Transcripts Accumulating during Cold Storage of Potato (SolanumTuberosum L.) Tubers are Sequence related to Stress-Responsive Genes (1994) Joachim van Berkel, Francesco Salamini, and ChristianeGebhardt
This experiment gathered many clones corresponding to cold-induced transcripts. • RNA hybridizations revealed accumulation patterns for the inducible transcripts. • Two-Dimensional Gel Electrophoresis • Construction and Screening of cDNA Library • Northern Blot Analysis • Southern Blot Analysis • DNA sequencing and Data Analysis
Results: 2-D gel. • Figure A: Expression at 4°C for 7Days • Squares indicate differences in polypeptide products. • Figure B: Expression at 20°C for 7 Days
Conclusion • Most of the changes in tuber expression were initiated after day 7 in the experiment. • Expression levels of cold-sweetening genes were higher for the potatoes exposed to cold stress. • These expression levels returned to normal after the potatoes were returned to room temperature.
What else could be done? • These methods are time consuming and do not allow precise quantification. • Similar methods may be performed in order to quantify the expression levels of the Cold Sweetening B Gene
We could study samples of potato at different temperatures and measure their gene expression for the Cold Sweetening B gene • The hypothesis is that there will be increased expression in tissues exposed to colder temperatures and less expression due to higher temperatures. This will be identified by the intensity of fluorescence obtained from a Real-Time PCR
Real Time PCR • One of the newer techniques • Real-Time PCR uses fluorescent dyes or oligonucleotide probes that will fluoresce when hybridized to a complementary DNA • This will allow the quantification of relative gene expression for a particular tissue.
Since we know the sequence, we can design sequence specific primers to amplify a sequence • Quantitative Real-Time Polymerase Chain Reaction will amplify this sequence enabling expression comparisons to be made between samples. • This would indicate whether or not the expression of Cold Sweetening B is changed significantly by cold stress
Quantification • The light emitted from the dye in the excited state is received by a computer and shown on a graph display showing PCR cycles on the X-axis and a logarithmic indication of intensity on the Y-axis.
This allows an accurate quantification that enables comparisons of expression between samples at different temperature exposures THE END