Download
1 / 18
180 likes | 186 Views
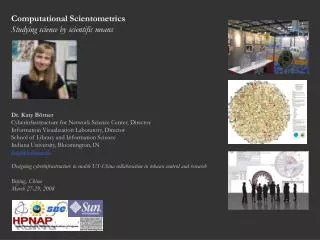
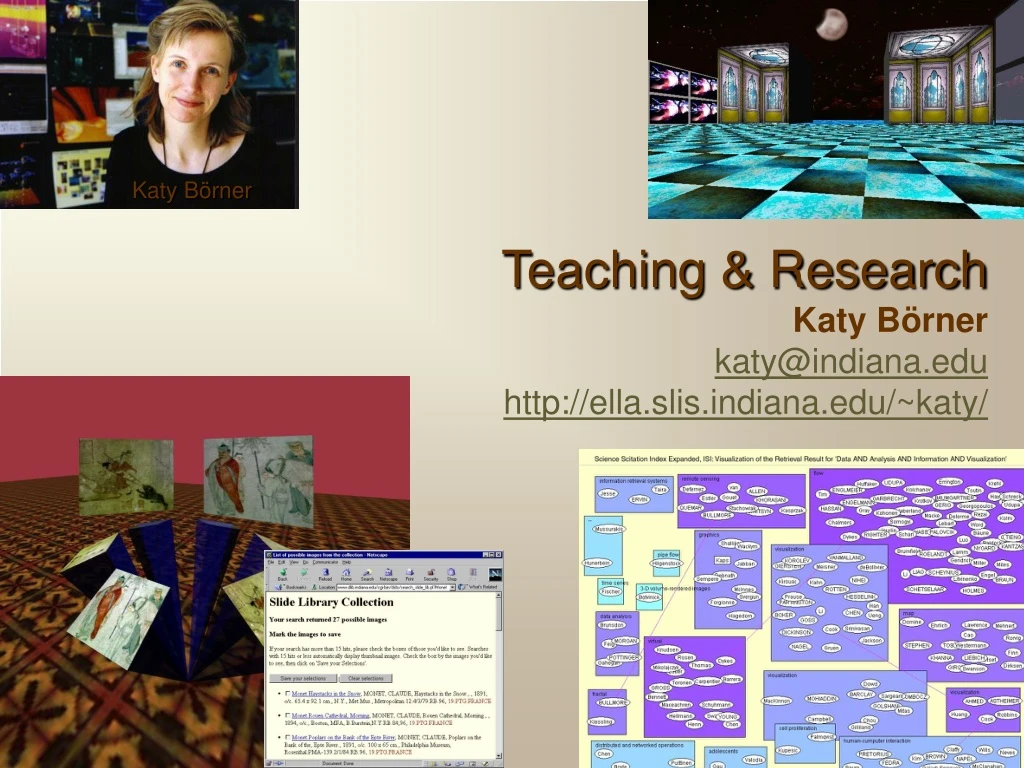
Teaching & Research Katy Börner katy@indiana.edu http://ella.slis.indiana.edu/~katy/. Teaching. L542 Human Computer Interaction (Fall & Spring) L578 (soon L575) Interface Design for Collaborative Information Spaces (typically in Fall, Summer I)

E N D
Teaching & ResearchKaty Börnerkaty@indiana.eduhttp://ella.slis.indiana.edu/~katy/
Teaching • L542 Human Computer Interaction (Fall & Spring) • L578 (soon L575) Interface Design for Collaborative Information Spaces (typically in Fall, Summer I) • L642 Advanced Topics in Human Computer Interaction (Summer I, 2003) • L697 (soon 579) Information Visualization (typically in Spring) Research • iUniverse: Creating a Collaborative Information Universe for IU • Twin-Worlds - Memory Palaces & Mirror Gardens • Visual Interfaces to Digital Libraries • Information Visualization Software Repository • Visualizing Knowledge Domains
L542 Human Computer Interaction This course covers • Basic cognitive psychology issues relevant to HCI. • Capabilities and limitations of today's input and output devices. • How to conduct a user and task analysis. • Interface design and evaluation issues. • The design and conduction of usability studies. • The software developer's professional and ethical responsibilities to software users and society as a whole. Students do weekly readings, provide a presentation on specific readings, design Web projects and participate in class & online discussion. Class Webpage: http://ella.slis.indiana.edu/~katy/L542/
L578 Interface Design for Collaborative Information Spaces This course covers • An overview about the state of the art in text based, 2-dimensional, and 3-dimensional Interface design. • User and task analysis. • Interface goals & interface design methods. • Design for usability and sociability. • Empirical evaluation of user interfaces. • Discussion of fundamental issues in the field. Students do weekly readings, provide a presentation on specific readings, do JavaScript and 3-D Virtual Worlds projects, and participate in class & online discussion. Class Webpage: http://ella.slis.indiana.edu/~katy/L578
L697 Information Visualization This course covers • Perceptual basis of information visualization. • Data mining algorithms that enable extraction of relationships in data. • Visualization and interaction techniques. • Discussions of systems that drive research and development, and • Future trends and remaining fundamental problems in the field. Students do weekly readings, provide a presentation on specific readings, do Java projects, and participate in class & online discussion. Class Webpage: http://ella.slis.indiana.edu/~katy/L697
iUniverse: Creating a Collaborative Information Universe for IU Purpose: Aims at the design and evaluation of collaborative 3D online ‘Learning Environments’ for IU faculty. Technology: Active Worlds, Desktop Mode: Multiple User http://iuni.slis.indiana.edu/ Katy Börner & Yu-Chen Lin: Visualizing Chat Log Data Collected in 3-D Virtual Worlds. Information Visualisation Conference, London, England, July 25-27, pp. 141-146, 2001.
iUni Virtual World Navigation activity Object click activity
Twin-Worlds - Memory Palaces & Mirror Gardens Katy Börner: Using Twin Worlds to Research Digital Cities and Their Evolving Communities. The Second Kyoto Meeting on Digital Cities Digital Cities 2001 -International Symposium and Workshop, Kyoto, Japan, October 18-20. To be published by Springer. Memory Palaces Provide intuitive, efficient, and collaborative document access for a scholarly community. Mirror Gardens Visualize user interaction data to evaluate the effectiveness and usability, to optimize design properties, or to examine the evolving user community of a world.
LVis – Digital Library Visualizer Purpose: Aims at the support of the navigation through complex information spaces. Technology: CAVE Mode: Single User http://ella.slis.indiana.edu/~katy/InfoVis/ Katy Börner, Andrew Dillon & Margaret Dolinsky (2000) LVis - Digital Library Visualizer. Information Visualisation 2000, Symposium on Digital Libraries, London, England, 19 -21 July, pp. 77-81.
Information Visualization Software Repository http://ella.slis.indiana.edu/~katy/L697/code/
Stock Tracker Larry Mongin & Steve Rice
SLIS Student Academic Career Viewer Jason Baumgartner & Tim Waugh
Newsgroup Votes Visualization David Heald (Collaborator John C. Paolillo)
Hyperbolic Tree Visualization of Roget's Thesaurus Jason Baumgartner & Tim Waugh (Collaborator John Old)
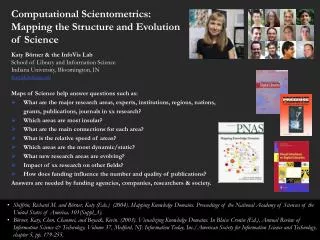
Visualizing Knowledge Domains • Apply advanced data mining and information visualization techniques to large amounts of, e.g., publication, patent, and grant data. • Visualizations objectively identify major research areas, experts, institutions, grants, publications, journals, etc. in a research area of interest, to identify interconnections, the import and export of research between fields, the dynamics (speed of growth, diversification) of scientific fields, scientific and social networks, and the impact of strategic and applied research funding programs among others. • Results are not only interesting for funding agencies but also for companies, researchers, and society. Kevin W. Boyack & Katy Börner: Indicator-Assisted Evaluation and Funding of Research: Visualizing the Influence of Grants on the Number and Quality of Research Papers, Journal of the American Society of Information Science and Technology, submitted 2002. Katy Börner, Chaomei Chen, & Kevin Boyack: Visualizing Knowledge Domains. Annual Review of Information Science & Technology, Volume 37, 2002. (in press)
Author supplied linkage patterns from grants to publications with links highlighted in red for grant 01 P50 AG11715-01.