Download
1 / 34
340 likes | 521 Views
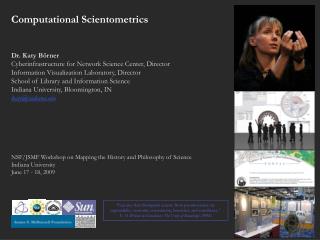
Designing Insightful ( Network ) Visualizations of Scholarly Activity Dr. Katy Börner Cyberinfrastructure for Network Science Center, Director Information Visualization Laboratory, Director School of Library and Information Science Indiana University, Bloomington, IN katy@indiana.edu

E N D
Designing Insightful (Network) Visualizations of Scholarly Activity Dr. Katy Börner Cyberinfrastructure for Network Science Center, Director Information Visualization Laboratory, Director School of Library and Information Science Indiana University, Bloomington, IN katy@indiana.edu Networks and Network Analysis for the Humanities Institute for Pure and Applied Mathematics, UCLA, Los Angeles, CA August 16, 2010
Computational Scientometrics OR Science of Science Studies Börner, Katy, Chen, Chaomei, and Boyack, Kevin. (2003). Visualizing Knowledge Domains. In Blaise Cronin (Ed.), ARIST, Medford, NJ: Information Today, Inc./American Society for Information Science and Technology, Volume 37, Chapter 5, pp. 179-255. http://ivl.slis.indiana.edu/km/pub/2003-borner-arist.pdf Shiffrin, Richard M. and Börner, Katy (Eds.) (2004). Mapping Knowledge Domains. Proceedings of the National Academy of Sciences of the United States of America, 101(Suppl_1). http://www.pnas.org/content/vol101/suppl_1/ Börner, Katy, Sanyal, Soma and Vespignani, Alessandro (2007). Network Science. In Blaise Cronin (Ed.), ARIST, Information Today, Inc./American Society for Information Science and Technology, Medford, NJ, Volume 41, Chapter 12, pp. 537-607. http://ivl.slis.indiana.edu/km/pub/2007-borner-arist.pdf Börner, Katy (2010) Atlas of Science. MIT Press. http://scimaps.org/atlas 2
Visualization Design using a modular data acquisition/analysis/modeling/ visualization pipeline as well as modular visualization layers. Börner, Katy (2010) Atlas of Science. MIT Press. 3
Deployment of results is enabled through paper printouts, online animations, or interactive, three-dimensional, audiovisual environments. The Legend Design delivers guidance on the purpose, generation, and visual encoding of the data. Mapmakers should proudly sign their visualizations, adding credibility as well as contact information. In many cases, it is desirable to Interact with the data, that is, to zoom, pan, filter, search, and request details on demand. Selecting a data entity in one view might highlight this entity in other views. Sometimes it is beneficial to show multiple simultaneous views of the data, here referred to as Combination. Frequently, Aggregation/Clustering techniques are applied to identify data entities with common attribute values or dense connectivity patterns. Graphic Design refers to the visual encoding of data attributes using qualities such as size, color, and shape coding of nodes, linkages, or surface areas. Placing the Raw Data in a reference system reveals spatial patterns. Projections/Distortions of the reference system help emphasize certain areas or provide focus and context. Reference Systems organize the space. Visualization Design using a modular data acquisition/analysis/modeling/ visualization pipeline as well as modular visualization layers. 4 4
Co-word space of the top 50 highly frequent and bursty words used in the top 10% most highly cited PNAS publications in 1982-2001. Mane & Börner. (2004) PNAS, 101(Suppl. 1):5287-5290. Mapping Topic Bursts 7
Mapping Indiana’s Intellectual Space • Identify • Pockets of innovation • Pathways from ideas to products • Interplay of industry and academia
Mapping the Evolution of Co-Authorship Networks Ke, Visvanath & Börner, (2004) Won 1st price at the IEEE InfoVis Contest. 9
Research question: Is science driven by prolific single experts or by high-impact co-authorship teams? Contributions: New approach to allocate citational credit. Novel weighted graph representation. Visualization of the growth of weighted co-author network. Centrality measures to identify author impact. Global statistical analysis of paper production and citations in correlation with co-authorship team size over time. Local, author-centered entropy measure. Studying the Emerging Global Brain: Analyzing and Visualizing the Impact of Co-Authorship Teams Börner, Dall’Asta, Ke & Vespignani (2005) Complexity, 10(4):58-67. 11
Compare R01 investigator based funding with TTURC Center awards in terms of number of publications and evolving co-author networks. Zoss & Börner, forthcoming. Mapping Transdisciplinary Tobacco Use Research Centers Publications
Research questions: 1. Does space still matter in the Internet age? 2. Does one still have to study and work at major research institutions in order to have access to high quality data and expertise and to produce high quality research? 3. Does the Internet lead to more global citation patterns, i.e., more citation links between papers produced at geographically distant research instructions? Contributions: Answer to Qs 1 + 2 is YES. Answer to Qs 3 is NO. Novel approach to analyzing the dual role of institutions as information producers and consumers and to study and visualize the diffusion of information among them. Spatio-Temporal Information Production and Consumption of Major U.S. Research InstitutionsBörner, Katy, Penumarthy, Shashikant, Meiss, Mark and Ke, Weimao. (2006) Mapping the Diffusion of Scholarly Knowledge Among Major U.S. Research Institutions. Scientometrics. 68(3), pp. 415-426. 15
Co-authorship collaborations of the Beijing branch of the Chinese Academy of Sciences (left) and six regional branches (3 shown on right) with countries around the world. Collaborating countries are colored on a logarithmic scale by the number of collaborations from red to yellow. The darkest red denotes 3,395 collaborations by all CAS researchers in Beijing. Flow lines are drawn from the location of focus to all locations collaborated with. Line width is linearly proportional to the number of joint papers. Research Collaborations by the Chinese Academy of SciencesBy Weixia (Bonnie) Huang, Russell J. Duhon, Elisha F. Hardy, Katy Börner, Indiana University, USA 16
Richard Klavans and Kevin Boyack. 2007. Maps of Science: Forecasting Large Trends in Science. Data: WoS and Scopus for 2001–2005, 7.2 million papers, more than 16,000 separate journals, proceedings, and series Similarity Metric: Combination of bibliographic coupling and keyword vectors Number of Disciplines: 554 journal clusters further aggregated into 13 main scientific disciplines that are labeled and color coded in a metaphorical way, e.g., Medicine is blood red and Earth Sciences are brown as soil. 17
Where Are the Academic Jobs? Interactive Exploration of Job Advertisements in Geospatial and Topical SpaceAngela Zoss, Michael Connover, Katy Börner (2010) http://cns-nd3.slis.indiana.edu/mapjobs/geo 19
Herr II, Bruce W., Gully Burns, David Newman, Edmund Talley. 2007. A Topic Map of NIH Grants 2007. 20
Interactive Science Map of NIH FundingHerr II, Bruce W., Talley, Edmund M, Burns, Gully APC, Newman, David & La Rowe, Gavin. (2009). http://scimaps.org/maps/nih/2007 21
Interactive Maps of Science – NIH Funding Google maps with charts and tables http://scimaps.org/maps/nih/2007
Math Law Computer Tech Policy Statistics Economics CompSci Phys-Chem Vision Chemistry Education Physics Psychology Brain Environment GeoScience Psychiatry MRI Biology BioChem Bio- Materials Microbiology Plant Cancer Animal Disease & Treatments Infectious Diseases Virology 2002 Base Map of ScienceKevin W. Boyack, Katy Börner, & Richard Klavans (2007). Mapping the Structure and Evolution of Chemistry Research. 11th International Conference on Scientometrics and Informetrics. pp. 112-123. • Uses combined SCI/SSCI from 2002 • 1.07M papers, 24.5M references, 7,300 journals • Bibliographic coupling of papers, aggregated to journals • Initial ordination and clustering of journals gave 671 clusters • Coupling counts were reaggregated at the journal cluster level to calculate the • (x,y) positions for each journal cluster • by association, (x,y) positions for each journal
Math Law Computer Tech Policy Statistics Economics CompSci Phys-Chem Vision Chemistry Education Physics Psychology Brain Environment GeoScience Psychiatry MRI Biology BioChem Bio- Materials Microbiology Plant Cancer Animal Infectious Diseases Virology Science map applications: Identifying core competencyKevin W. Boyack, Katy Börner, & Richard Klavans (2007). Funding patterns of the US Department of Energy (DOE) GI 24
Math Law Computer Tech Policy Statistics Economics CompSci Phys-Chem Vision Chemistry Education Physics Psychology Brain Environment GeoScience Psychiatry MRI Biology BioChem Bio- Materials Microbiology Plant Cancer Animal Infectious Diseases Virology Science map applications: Identifying core competencyKevin W. Boyack, Katy Börner, & Richard Klavans (2007). Funding Patterns of the National Science Foundation (NSF) GI 25
Math Law Computer Tech Policy Statistics Economics CompSci Phys-Chem Vision Chemistry Education Physics Psychology Brain Environment GeoScience Psychiatry MRI Biology BioChem Bio- Materials Microbiology Plant Cancer Animal Infectious Diseases Virology Science map applications: Identifying core competencyKevin W. Boyack, Katy Börner, & Richard Klavans (2007). Funding Patterns of the National Institutes of Health (NIH) GI 26
Math Law Computer Tech Policy Statistics Economics CompSci Phys-Chem Vision Chemistry Education Physics Psychology Brain Environment GeoScience Psychiatry MRI Biology BioChem Bio- Materials Microbiology Plant Cancer Animal Infectious Diseases Virology Science map applications: Identifying core competencyKevin W. Boyack, Katy Börner, & Richard Klavans (2007). Funding Patterns of the National Institutes of Health (NIH) GI 27
Scholarly Database: 23 million scholarly records http://sdb.slis.indiana.edu VIVO Research Networking http://vivoweb.org Information Visualization Cyberinfrastructure http://iv.slis.indiana.edu Network Workbench Tool & Community Wiki http://nwb.slis.indiana.edu Science of Science (Sci2) Tool and CI Portal http://sci.slis.indiana.edu Epidemics Cyberinfrastructure http://epic.slis.indiana.edu/ Computational Scientometrics Cyberinfrastructures 28
Scholarly Database (http://sdb.slis.indiana.edu) The Scholarly Database at Indiana University provides free access to 23,000,000 papers, patents, and grants. Since March 2009, users can also download networks, e .g., co-author, co-investigator, co-inventor, patent citation, and tables for burst analysis. 29
VIVO is a 2-year, $12 Million dollar project funded by NIH. VIVO 1.0 source code was released on April 14, 2010. The more institutions adopt VIVO, the more high quality data will be available to understand, navigate, manage, utilize, and communicate progress in science and technology. 06/2010 30
Network Workbench Tool (http://nwb.slis.indiana.edu) The Network Workbench (NWB) tool supports researchers, educators, and practitioners interested in the study of biomedical, social and behavioral science, physics, and other networks. In Aug. 2009, the tool provides more 160 plugins that support the preprocessing, analysis, modeling, and visualization of networks. It has been downloaded more than 60,000 times since October 2006. Herr II, Bruce W., Huang, Weixia (Bonnie), Penumarthy, Shashikant & Börner, Katy. (2007). Designing Highly Flexible and Usable Cyberinfrastructures for Convergence. In Bainbridge, William S. & Roco, Mihail C. (Eds.), Progress in Convergence - Technologies for Human Wellbeing (Vol. 1093, pp. 161-179), Annals of the New York Academy of Sciences, Boston, MA. 31
Sci2 Tool for Science of Science Research and Practice (http://sci.slis.indiana.edu/sci2) 32
Sci2 Tool for Science of Science Research and Practice (http://sci.slis.indiana.edu/sci2) See NEH Tutorial on Tuesday 9am-Noon Co-taught with Scott Weingart 33
All papers, maps, cyberinfrastructures, talks, press are linked from http://cns.slis.indiana.edu 34