Download
1 / 25
260 likes | 406 Views
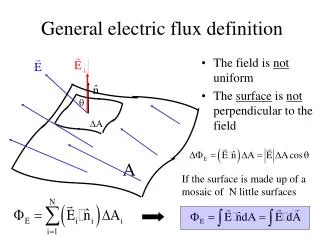
HST. 850 μ m. Whitmore et al. Continuum Observing in the Submm/mm Tracy Webb (McGill). continuum: flux integrated over a range in wavelength. line: spectral resolution (Petitpas et al.). Next 40 mins. how do we make continuum measurements? some specific physics we can measure

E N D
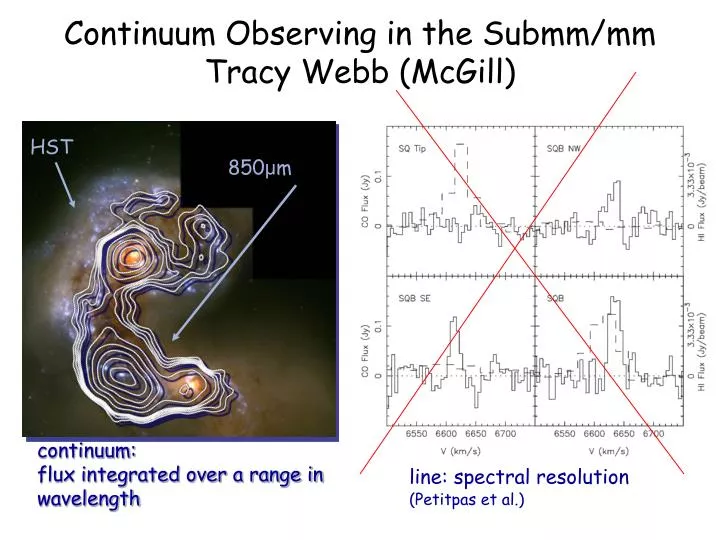
HST 850μm Whitmore et al Continuum Observing in the Submm/mm Tracy Webb (McGill) continuum: flux integrated over a range in wavelength line: spectral resolution (Petitpas et al.)
Next 40 mins ... how do we make continuum measurements? some specific physics we can measure examples of recent continuum science
what is the submm/mm? generally defined as: 200m-1mm “submillimeter” 1mm - 10mm “millimeter” shorter wavelengths mid-far-infrared longer wavelengths cm and radio sources of submm/mm radiation thermal emission -- cold dust and CMB synchrotron -- relativistic electrons in SNR free-free (Bremstrahlung) -- ionized gas (inverse compton scattering -- SZ clusters) these mechanisms are generally associated with structure formation physics, young objects, and optically obscured regions
why work in the submm/mm continuum? • technology just becoming mature • ‘breakthrough’ science still possible • JCMT-SCUBA citation rate rivals HST! • > 1/2 the total energy in the cosmic background 1996 UKT14 1 pixel 2007 SCUBA2 104 pixels! science areas for continuum work: - debris/proto-planetary disks - Galactic star formation regions - ISM in local galaxies - high-redshift galaxy formation - high-redshift clusters - SZ effect - CMB cosmology
limited by the atmosphere: what wavelengths are possible from the ground? 750µm 850µm 350µm 450µm
JCMT facilities: single-dish & interferometers Submillimeter Array
Detectors and Receivers: Bolometer Arrays (not to scale) SCUBA (to scale) SCUBA-2 Incoming photons drive change in T and therefore change in R. Signal is read as voltage or current. used on single dish detectors provide wide bandwidth can be wide-field multi-pixel Transition Edge Sensors fast, linear response, sensitive
EMR antenna IF amplifier RF amplifier further analysis/detection electronics mixer tunable local oscillator Detectors and Receivers: heterodynes collapse over wavelength to form image IF = RF - LO IF = RF + LO preserves phase and spectral information useful for line and continuum work single dish and arrays small bandwidth 1-2 GHz single or very few pixels Neri et al.
jiggle maps creating a continuum map • two basic and almost universal problems (cf SCUBA2): • need to remove the sky: absorption, emission, noise • H20 molecular transitions, thermal emission, changing temporally +spatially • arrays usually under sample the sky and heterodynes are often only one pixel “chop and nod” mapping throw A B C source sky sky measures differences in flux throws: 30-120 arcsec frequency: many Hz scan maps
a comparison of some submm continuum facilities ground based JCMT 15m SCUBA2 450µm/850µm 104 pixels Northern CSO 10m SHARC-II 350µm 384 pixels Northern Apex 12m LaBoca 870µm 295 pixels Southern LMT 50m AzTec 1.1mm/2.1mm 144 pixels Southern IRAM 30m MAMBO-2 1.2mm 117 pixels Northern airborne observatories BLAST 2m 250µm -500µm SOFIA 2.5m 0.3µm -1.3mm Herschel 3.5m 60µm-700µm interferometers SMA 8x6m Hawaii IRAM PdB 5 x 15m France CARMA California (BIMA+OVRO) 6x10m + 10x6m ALMA (not yet operational) see later talk
submm emission: thermal radiation from cold dust T = 10-100K dust peaks at 30µm-300µm peaks where the atmosphere is opaque but still substantial flux in the submm (especially when redshifted) T=3K (CMB) peaks at 1mm Wien’s displacement law:
never a simple single-temperature Black Body small grains: < 0.1µm in size not in thermal equalibrium with the interstellar radiation field (ISRF) but are heated stochastically most of the time very cold, but spike to 100-1000K large grains: >0.1 µm in size in thermal equalibrium with ISRF generally 10-100K dust temperature depends on heating mechanism and distribution: star formation, active galactic nucleus, old stars compact hot dust vs diffuse cold dust emissivity (emission efficiency) where ~1-2 thermal spectrum becomes S B(T) hot dense cores in Orion cold diffuse Galactic dust
‘secondary’ sources of emission thermal synchrotron free-free relativistic electrons in supernova remnants ionized gas CO line contamination from molecular gas these processes are often found together! dust = gas = star formation = supernovae/hard radiation field
specific constraints provided by continuum measurements dust temperature (Dunne et al. 2002) Md = S850 D2/(d() B(T)) dust mass (Hildebrand 1983) assuming optically thin dust flux density distance emissivity star formation rate (Bell 2003) (LTIR estimated from fitting SED to FIR/submm)
debris disks - extra-solar (proto) planetary systems cold disks of dust debris around stars Holland et al.
star forming regions in the Galaxy: sites of obscured star formation in the Eagle nebula 450µm with SCUBA White et al. 1999 HST image
the mass function of cold dusty clumps consistent with a Salpeter initial mass function! (Reid & Wilson)
continuum emission from supernova remnants . Dunne et al. 2004 Dwek et al. 2004 evidence for dust in supernovae -- process of dust production at high redshift (ie z~6)?
Ultraluminous IR Galaxies (ULIRGs) the most luminous systems are also the dustiest and the most IR/submm bright -- 90% of their energy is emitted in the FIR/submm galaxy models of Silva et al. blue - no dust starburst red - dust added Sanders & Mirabel review
Whitmore et al what can we learn about nearby galaxies? spatial correlation between optical/UV and FIR/submm? multi-temperature components multi-dust components dust mass estimates ... (Dunne et al. 2002; Wilson et al. 2004) 850m contours over optical images
high redshift galaxies: the advantage of the K-correction 850μm redshift 1-9 at long wavelengths FIR-bright galaxies do not get fainter as they get further away!
ALMA high-resolution submm imaging:Iono et al. 2006 submm and UV emitting regions are different no evolution SCUBA2 filamentary structure on 400kpc scales around z=2 QSO Stevens et al. 2005 submm source counts: Scott et al. 2002 orders of magnitude evolution from z=0-3
galaxy clusters and the Sunyaev-Zel’dovich effect: probes of cosmology decrease in CMB intensity increase in CMB intensity hot electrons in intracluster gas inverse compton scatter background CMB photons to higher energies Carlstrom et al. SZ facilities: Apex-SZ (Chile), ACBAR (South Pole) CBI (Chile), DASI (South Pole), ACT (Chile) ... SCUBA2?
the future of continuum observing in the submm (i.e. is there anything left to learn?) we have be limited by large beams, low sensitivity, slow mapping speed- no longer. 25 nights with SCUBA z~0 z~1 z > 2 2 nights 2ith SCUBA2 dusty starbursts with HST in the optical ALMA has similar resolution in the submm! large scale structure and statistical astronomy Governato et al. 1998